Introduction
Epileptic-seizures(commonly called as “epilepsy”) are a prolonged neurological disorders which can cause frequent seizures characterized by sudden-unexpected, extremely disordered, hyper synchronous, plus a confined electrical release of clustered-neurons in human/or animal brain which can momentarily variate the functions of h-brain, (i.e. ephemeral/transient diminishing harms and of consciousness and feeling, and the state of changed perception, and/or unconscious (changing the consciousness), and principal (focal) spontaneous actions and activities or fibrillational-convulsions (sawtooth potentials). 1
Abrupt and unexpected chronic-seizures may have considerable impact on epileptic-seizures patient life. Apparently consistent and dependable instantaneous/immediate and simultaneously (online real-time) detecting e-seizures may possibly and drastically enhance the restorative (and also therapeutic) capabilities and possibilities such as adaptive closed loop systems device-therapies (for instance adaptive closed loop deep brain stimulation DBS systems and devices). In adaptive closed loops treatments, stimulus intensities (electrical current voltage), medicine distillation and fermentation, refrigeration, or bio feed - back (lumped) can be sent in reaction toe- seizure tracings or detections.2
Epileptic subjects (i.e., patients} are typically diagnosed through the anti-epileptic drugs(A.E.Ds) to prevent the e-seizures to be happened, 3 accurate online/real-time (with multichannel encephalographic systems device recorders through wired and wireless head worn) seizures tracings are crucial for reducing dyskinesias/side-effects followed by adverse effects through upon request distributing of A.E. drugs throughout the phase angle of pre ictal and through temporary substitute-drugs just for brief.
A common standard traditional method for the diagnostics of epileptic-seizures (epilepsy) disorder is the encephalograph signals acquisitions for weeks long and for many days (typically 2 to 3 weeks) followed by continuous focal and visual examinations. Which is a cumbersome procedure and laborious, and, also, clinicians precious time consumption. Thus, to overcome this limitation, a real time online robust and also sturdy system for detecting the e-seizures effectively can accelerate and also enable long-term monitoring plus pinpointing the epilepto-genic zone (EZ, i.e., a region of the particular zone of brain which can produce the epileptic-seizures), and that is most useful and imperative in pre op assessments. With the introduction of the epileptic-seizure identification with the biomarkers i.e., seizure markers, the focus is more on biomarkers research currently in research laboratories and in most of the laboratories especially in North America, Europe, Japan, Australia, China and some advanced and upcoming countries like largest democratic India. Consequently, a huge demand for building the markers interfacing the with the automatic seizure detection (A.S.D) devices and systems recorders. An epileptic-seizure detection system must be intelligent to detect the incidence or seizures manifestations as of currently ongoing intra cranial encephalograph3 through categorizing subjects encephalograph waveforms of the particular brain.
Many methods were developed with several modalities for detecting the seizures effectively through the automatically generating the systems however, the principal key components of seizures is the feature extractions and associations i.e., clustering and then associations from one cluster through another, if at all any is there as of e-brain electrical seizure-activity followed by its associations. Previously many methods were proposed in both time and frequency pulse and sampling domains also mutually informative theory to extract the feature-manifestations. 4, 5, 6, 7
The experimental mode decomposition (E.M.D) techniques were employed previously for extrapolating feature-manifestations as of Innate and inherent mode functions (I.M.F.s) of electro encephalo graphic waveforms (signals) for effective detections of seizures.8, 9, 10, 11, 12, 13 In a study by Pachori (2008), the computation of the frequency of the mean of I.M.F.s were employed as a feature for observing the distinction amid ictal-seizures followed by interictal-seizure-(free) of E.E.G.s waveforms/signals.8 In another study, were employed the subjective and biased weighted cycles of I.M.F.s like features-sets for distinguishing normal as of abnormal e-seizure electro encephalograms signals/waveforms.
In our study, we developed a feature-selection feature-technique, and that is depending on the average amount of mutual information non linear analysis estimates14, 15 for effective seizure detection. The A.A.M.I is a non-parametric quantity of dependency amongst stochastic theory random-variables that are non-negative (not negatives) mostly.
Aims and Objectives
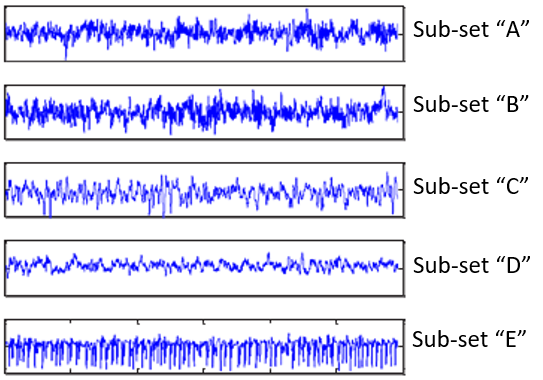
In connection with the A.A.M.I, objective or goal of feature-associations/selections is compute the feature-manifestations as of a significant features-sets that mutually have had biggest dependence upon class-objective. The new and unique-features/ and manifestations were obtained as of R.Q.A. of electro encephalogram wave forms/signals. In turn, the R.Q.As. encephalograph-signals data were applied to distinguish the non-linear dynamical systems E.E.Gs plus extrapolate suitable feature-manifestations for detecting the e-seizures automatically. The following Figure 1 shows the electro encephalographic wave forms acquired through recording system.16 The the signals data sets comprise 500 unique-channels (Figure 1) E.E.G. fragments, and every sample lasted at each lasts for the duration of 25 seconds and the same is also classified in to 5 sub sets (exhibited as sets A - E) but every sub set consists one hundred100 segments of E.E.G.s.
Figure 1
Intracranial encephalographs as every 5sub sets namely from sub-set “A” to “E.” subset A however contaminated with more noise and also some distortions as well. The signal is so compressed.

Data acquisition
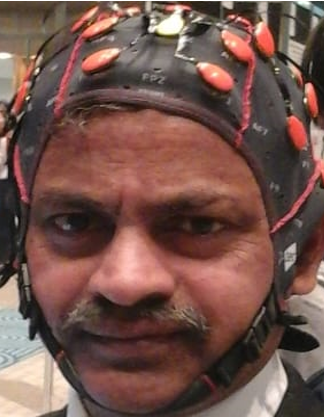
The data acquired as of 5 controls sub- sets namely, “A” and “B” following their visual potentials opened and is also by closing with wired and head worn typical encephalograph-electrodes 30 arranged. The sub sets “C” and “ D” comprises the encephalograph waveform-signals acquired whilst seizure inter ictal periods as of EG zonal-areas regions plus forming the hippocampus of parallel brain hemi-sphere (BHS) correspondingly. Where, as, sub- set “E” follows the sections of the encephalograph-fragments subsequently to e-seizure incidents, and these are acquired whilst applying almost all the 30electrodes grid (Figure 2).
Encephalograph waveforms were acquired in a digital amplitudes data formatting with a sampling-frequency of 175Hertz and later were filtered with band pass filters amid 0.5hertz to 50 hertz, according to Indian English Channel). The above Figure 1 shows the usual signals of electro encephalogram’s as of the sub- sets, respectively.
Materials and Methods
The process of computation
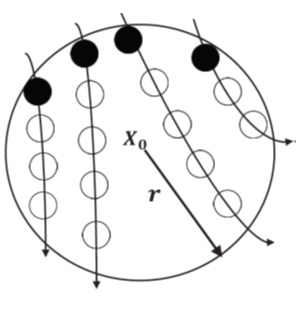
The initial feature-manifestations were obtained as of R.Q.A. by using the intra cranial enecephalograph data. As usual, we first reconstruct shape of the waveforms (i.e., phases which represent the angles in the x and y axis), i.e., phase-amplitudes trajectory in the spatiotemporal regions followed by constructing recurrence plot (designated as “RP”). The recurrence is a statistical-technique, with which one can envision or imagine the reappearance/recurrence of the states-spaces (of systems) of a dynamical systems mathematical theory in the spatiotemporal regions.
Reconstructing the signals shapes (phases and the regions (spaces)
It is well known that the one of the significant factors of dynamical mathematical systems theory is first reconstructing the “phase and space”. A phase-- space of a typical hypothetical dynamical mathematical frameworks system is a phase space, if and only if it shows all the states of system, and every state-of-system connects to links to one single and distinctive unique-point in spatio temporal regions (i.e., in phase time and space). The “phase—space” is a geometrically representing the dynamical systems (or “systems dynamics”). A usual technique for the application of phase and space reconstruction is the “Takein time delaying system” 17. In accordance with, as stated by the Takein model, the dynamical systems time-series [u1, u1, u2, …, u N] can be fixed in an m×n (m=n)dimensional-space (phase-space through vector-quantity variable as given below:
Where, the “τ” also “m” gives the duration of the delays plus fixed-dimensions correspondingly. For capturing systems-dynamics, a suitable timing-delay followed by fixing the dimensions must be selected. An appropriate time-delaying is the minima of first local of the AAMI function.18 Cao,et.al.,19 in (1997) suggested a procedure to derive the fixed minimal dimensions as of the scalar-quantity time-series (only directional but no magnitudes). The technique was beginning through a smaller and smallest quantity(value) fixed-dimensions mxn plus expanding it till the number-of-false neighborhoods is decreased (decreases) or reduces to 0 (zero). This study applied the AAMI plus the techniques of19 to estimate duration of the delays and also fixing dimensions, correspondingly.
Computing with the recurring scenario
The technique of recurrent relation is a considerable sort of dynamical brain signal processing statistical inherent systems [221]. In a study by20 the researchers established a technique to envision recurrent relation of system dynamics (“dynamical-systems”) referred to as “R.P”.21 Therefore, to build the “R.P”, a symmetrized N×N, i.e., M=N, M rows and N columns’) array-collection referred to as recurrent matrices “R”, was computationally done, which is computed as given below:
In which, “N” gives the number of states expected “x”,“Θ (x)” is called heavy factor (side) function (i.e.Θ(x) = 0 if x < and Θ (x) = 1 else), which is said to be space of the “threshold”, and ‖∙‖ is the norm( “Mathematically defined as a “norm is a function from a real/or a complex-vector-space to that of non -Ve real-numbers performs in confident and positive-ways corresponding the distance”). Vector—norm, an atlas which designates or attributes’ a “length” or “dimensional-size” to anykind of another vectorquantity in a “vector-space”.
Hitherto, the matric comprised of “0s” and “1s”. For computing the recurrent relation-matrix, an appropriate “norm” must be chosen. So, we applied the Euclidian-norm in this study, for computing the space amongst 2states. The dynamical-systems “R.P” has its specific net-work-topology. Such as, the ”R.P” correlated to recurrent regular-systems (“periodic”) which has complete unabridged plus long diagonal/and lengthy shapes and lineups.
The perpendicular void or space(distance) amid those sloping-lines shows time phase of fluctuatory oscillations. And “R.P” of tumultuous (“chaos”) system as well has sloping-lines, that are briefer than regular (“periodic”) systems through some particular perpendicular-spaces. However perpendicular-spaces in “chaotic-systems” are not as normal as in the “periodic-systems.”. So, the “R.P” of un correlated or related stochastic(non-linear) waveforms/signal comprizes several separate and yet specific dark and dim-points (Figure 3).
Results and Discussion
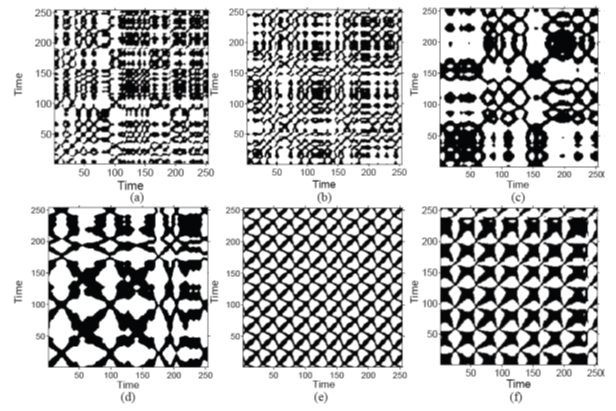
The following Figure 4 demonstrates the illustrations of “R.P” of the encephalon recordings corresponding to controls “A” (signal A) and “B” (signal B), inter - ictal “C”, “D”, followed by the ictal-signal “E” state-of-conditions. Once can examine from the Figures, there “vertical-lines” plus “horizontal-lines” constructions within “R.P” of control-subject see from Figure 4 (a) plus (b). In the computation, angles such as “rectangles” produced through perpendicular and parallel-lines demonstrate that the dynamical-systems will.
Figure 4
Computed images of seizures through recurrence of a block of sub-sets of the signals “A-E” corresponding to (A->(a), B->(b), C->(c), D->(d), E->(e), and (f))

Wedged within the state-of-condition and it won’t be changed and/or changes asymptotically or monotonically for hardly any moment. The perpendicular configurations or structural- phases within “R.P” of encephalon demonstrating intermittence plus laminal as well. Curious and fascinating reflection is the white-band structural phases in the course of for the period of e-seizure-free (see the Figure 4c, as well as Figure 4d.). The region of white-bands relates to abrupt and unexpected differences within systems-dynamics and also events-of-extrima`s (sidelobes) 22. While e-seizures are on, the hypotenuses-lines followed by checker board structural-phases (shapes) are examined within the “ . RP” (see the Figure 4e., plus 4.f.) and from this the phases i.e.,shapes and structural-changes shows the dynamical-system through intermittent and regular and/or pseudo(quasi) -periodic performance 22. Findings are indicating that “R.P” shows the dynamical-changes or variations of encephalon`s of EEGs wave forms/(signals) in the course throughout the course of the variant states of e-brain.
So, here one may note that there is a considerable area of fascinations and to build the efficient e-seizure detective machines for automatically discovering the epileptic seizure onset zones and is also where exactly the seizure is moving in that specific zone to be traced or detected.
Also, it may be noted here that the categorization of electroencephalon`s within the controls and abnormal ictal,inter ictal, and inter-ictals are the prime objectives epileptic-seizure (e-seizure) detections within the EEGs.
The feature classification procedure involves primely to elicitate and extrapolate the feature-extractions, followed by the feature-associations and is also feature-selections. Many methods were suggested by the many researchers previously for the EEGs signals analysis by applying the time-series for extracting the as many numbers of features as can yet, the linear-method nullify the nonlinear dynamics of the EEGs and also their inherent and fundamental concepts. This is due the complexities of the nonlinear EEGs dynamical systems understanding and also dearth of the skilled specialists in nonlinear systems dynamical systems. These are the variant transients amongst usual lineal laminal i.e., laminar plus disorganized disordered and tumultuous (so called “chaotic”) behavioral and behavioral- concepts.


