Introduction
Diabetes mellitus (DM) is a common metabolic disorder often results in microvascular and macrovascular diseases such as nephropathy, angiopathy, retinopathy, and peripheral neuropathy.1 The metabolic insults negatively affect the mental health status and quality life in affected individuals.2 Globally, 11.3% of deaths are due to diabetes.3 In 2019, a total of 463 million people are estimated to be living with diabetes, representing 9.3% of the global adult population (20–79 years). This number is expected to increase to 578 million (10.2%) in 2030 and 700 million (10.9%) in 20454 and currently, half (50.1%) of the people with diabetes do not know that they have diabetes. Alcohol is a toxic and psychoactive substance with dependence producing properties. Nearly 5.1% of the global burden of disease is attributable to alcohol consumption, and it causes nearly 3.3 million deaths every year. According to a report released by the World Health Organization5 in 2016, more than 3 million people died as a result of the harmful effects of alcohol which represents 1 in 20 deaths.
Though liver is the major organ for the oxidation of ethanol, followed by the stomach and other organs, the brain oxidizes a significant amount of alcohol with respect to several perspectives.6 Ethanol can cross the blood-brain barrier and it can be metabolized in the brain. The excessive intake of alcohol is a serious public health problem, especially, given the severe damage provoked by chronic or prenatal exposure to alcohol that affects many physiological processes, such as memory, motor function, and cognitive abilities. This damage is related to the ethanol oxidation in the brain. Existence of free radicals and their roles identified in biological systems was known in chemistry since nineteenth century,7 but the concept of nitroxidative stress was proposed only at the end of 20th century.8 Both alcoholism and diabetes affect a large population worldwide.9 Excessive alcohol consumption not only negatively impacts diabetes self-care adherence but also affects the course of diabetes.10 Alcohol abuse11 and diabetes can cause structural and functional deficits in the brain.12
“Nitroxidative stress” is a term has been used to indicate the cellular damage elicited by nitric oxide (NO) and its congener peroxynitrite (OONO-).13 Increase in NO content by alcohol could explain some of the pathological changes occurring in diabetics. Hence, our study focused on the association between alcohol-induced nitroxidative stress and their effect on enzyme activities in diabetic brain. Furthermore, the role of aqueous green tea extract, a powerful antioxidant against synergistic effect of diabetes by alcohol intoxication was investigated in this study. We employed the molecular docking method for neuronal nitric oxide synthase (nNOS), as a putative target of EGCG which will improve our understanding of the pharmacological mechanism of EGCG and identify novel potential therapeutic targets against this double jeopardy.
Aim
The supplementation of green tea renders protection against alcohol administered diabetic brain damage.
Materials and Methods
Chemicals
Streptozotocin (STZ), NADP, TBA, TCA and monoclonal nNOS primary antibody were purchased from Sigma-Aldrich Company (St. Louis, MO, USA). All other chemicals were of analytical grade and obtained from local commercial sources. Aqueous green tea leaf extract (GTE) dry powder (extract contains 75% catechins with 50% EGCG) was obtained from Guardian Biosciences, Phoenix, Arizona, USA.
Experimental animals and maintenance
Adult male albino Wistar rats, aged 10-12 weeks, weighing ~150-180g were procured from Sri Venkateswara Enterprises, Bangalore, India) and used for all experiments. Animals were housed in clean polypropylene cages having 8 rats per cage, maintained on a standard pellet diet (M/S. Hindustan Lever Ltd., Mumbai, India) and water ad libitum with 24 h light-dark cycle throughout the experimental period. The experiments were carried out under controlled conditions, in accordance with the guidelines and protocol approved by Sri Krishnadevaraya Animal Ethics Committee vide Reg no: 1889/GO/Re/S/16/CPCSEA/IAEC/SKU.
Experimental design
A total of 40 rats were divided into five groups, eight rats in each group (n=8), treated as follows.
Induction of diabetes
To the overnight fasted adult albino male Wistar rats, diabetes was induced by single intraperitoneal (i. p.) administration of a freshly prepared solution of STZ (45 mg/kg b. w) dissolved in 0.1 M cold citrate buffer (pH 4.5) as described by the method.14 The STZ-induced diabetic animals were allowed to drink 15% glucose solution after 6hr of STZ injection to overcome drug-induced hypoglycaemia. Rats with fasting blood glucose (FBG) ≥ 250 mg/dL on the third day following STZ injection were confirmed as diabetic and selected for this study.
Preparation of aqueous green tea extracts (GTE)
The aqueous extract of green tea leaves was prepared by soaking 10 g commercially available powder in 100ml distilled water in a glass jar for 72 h at room temperature and the liquid extract separated by filtration was used for treatment.
Alcohol administration and aqueous GTE treatment
Ethanol was administered orally at the dose of 5 g/kg. b.w/day (20% v/v) via orogastric tube for 60 consecutive days. Alcohol treatment was started to the STZ- diabetic rats from 3rd day, which was considered as day one for the alcohol treated diabetic rat group. GTE was administered at a dose of 300 mg/kg b.w/day for 60 days. Clinical monitoring of the animals was performed for body weight, brain weight, biochemical analysis and histopathological changes.
Collection of blood and tissue isolation
At the end of experimental period, animals were fasted overnight, weighed and sacrificed using anaesthetic ether followed by cervical dislocation. Blood samples from all the experimental rats were withdrawn by cardiac puncture and fasting blood glucose levels were determined. Brain tissue was immediately harvested, washed with ice-cold saline, weighed to the nearest gram levels. The tissues were suspended in HEPES buffer (pH 7.4) in polypropylene containers, labelled carefully and frozen in liquid nitrogen and stored at -80°C until further assays were carried out. A part of the tissue was stored in buffered formalin for histological examination.
In-vitro anti-diabetic activity
Α-Glucosidase inhibition assay
The α-glucosidase inhibitory activity of aqueous GTE was determined according to the method.15 Briefly, 250 μL of different concentrations (100, 200 and 300 μg/mL) of GTE in DMSO was incubated with α-glucosidase solution (500 μL of 1U mL-1) in 100 mmol L-1 phosphate buffer (pH 6.8) at 37 °C for 15 min. Thereafter, 4-Nitrophenyl α-D-glucopyranoside (pNPG) solution (5 mmol L-1) in 100 mmol L-1 phosphate buffer (pH 6.8) was added and the mixture was further incubated at 37 °C for 20 min. Ascarbose was used as the standard drug for inhibition of α-glucosidase. The absorbance of the released p-nitrophenol was measured at 405 nm and the inhibitory activity was expressed as percentage of a control sample without inhibitors. Negative control was α-glucosidase and pNPG.
Α-Amylase inhibition assay
The α-amylase inhibitory activity was determined by following the method,16 with some modifications. 250 μL of different concentrations (100–300 μg/mL dissolved in DMSO) of GTE and porcine pancreatic amylase (500 μL of 2 UmL-1) in 100 mmol L-1 phosphate buffer (pH 6.8) were incubated at 37 °C for 20 min. 1% starch dissolved in 100 mmol L-1 phosphate buffer (pH 6.8) was added to the reaction mixture and incubated at 37 °C for 1hr. 500 μL of DNS (3, 5-dinitrosalicylate) reagent was added and boiled for 10 min. The absorbance of the resulting mixture was measured at 540 nm and the inhibitory activity was expressed as percentage of a control sample without inhibitors. All assays were carried out in triplicate.
Evaluation of the anti-hyperglycemic activity of aqueous GTE
Rats were divided into seven groups, each containing four rats (n=4) for the evaluation of the anti-hyperglycemic activity of aqueous extract of green tea., group 1: normal control rats, group 2: alcoholic control rats, group 3: diabetic control rats and group 4: alcohol treated diabetic rats, where as groups 5, 6, 7: alcohol treated diabetic rats treated with aqueous GTE with the doses of 100, 200, 300 mg/kg respectively. After the oral administration of extract, blood samples were collected from the tail vein for glucose estimation.
Evaluation of nitroxidative stress and anti-oxidant status
Lipid peroxidation (LPO) was determined in total brain tissue homogenate by estimating the level of thiobarbuturic acid reactive substances (TBARS) and measured as malondialdehyde (MDA) by following the previous method.17 Protein carbonyls (PCO) content in the above samples was measured using DNPH method.18 Nitric oxide levels in the samples were estimated by using greis reagent method19 in terms of nitrates and nitrates and peroxynitrite (ONOO-) content was measured by using nitrophenol.20
Total reduced glutathione (GSH) content was measured by using Ellman’s reagent.21 The activity of glutathione peroxidase (GPx, EC 1.11.1.9) was assayed by the 5, 5’- dithiobis-2-nitrobenzoic acid (DTNB) method.22 Superoxide dismutase (SOD, EC 1.15.1.1) activity was assayed by the method.23 Catalase (CAT, EC 1.11.1.6) was assayed by following the method.24
Tissue Glycogen assay
Brain tissues were homogenized in ice-cold 6% perchloric acid (1:5 w/v) containing 1 mM EDTA. For measures of tissue glycogen content, glycogen was hydrolyzed to glucose in aliquots of homogenate that were removed and incubated overnight at room temperature with 0.2 M sodium acetate, 1M KHCO3, and 20 U/mL of amyloglucosidase. Adding perchloric acid solution stopped the reactions. After centrifugation, supernatants were neutralized with a KOH solution (3M KOH, 0.3M imidazole, and 0.4M KCl), centrifuged and taken for assays of glucose content as described.25
RNA isolation, cDNA synthesis and RT PCR
Total RNA from the tissue homogenate samples was extracted using TRIzol reagent. RNA concentration and quality in the extracted samples were measured using a Nano Drop ND-1000spectrophotometer (Thermo, USA). 2 μg of total RNA was treated with RNase-free DNase and reverse transcribed as per the manufacturer’s instructions. Diluted cDNA (1:20 v/v) was used for RT PCR, which was performed in an Mx3000 P (Stratagene, USA). GAPDH, which was unaffected by the experimental factors, was chosen as the housekeeping gene. All primers used in this study are listed in Table 2, and were synthesized by Generay Company (Shanghai, China). The2-△△Ct method was used to analyze the PCR results, and gene mRNA levels are expressed as the fold change relative to the mean value of the normal control rat group.
Western blot analysis
Western blot analysis was used to determine nNOS protein expression in the brain tissue of all the experimental rat groups in comparison with normal control group and β -tubulin was used as positive loading control. Equal amount of protein was loaded in each lane followed by separation using sodium dodecyl sulfate-polyacrylamide gel electrophoresis (SDS-PAGE) and electroblotted on PVDF membrane (Millipore, Massachusetts, USA). The membrane was blocked for 4.0 h at 37°C with 5% bovine serum albumin (BSA) solution. Then the membrane was incubated with nNOS (polyclonal) antibody (1:5000) for overnight at 4°C, followed by incubation with alkaline conjugated anti-rabbit antibody (1:2500) for 4.0 h. After washing, the membrane was developed using ECL solution. All western blots were performed under the same experimental conditions and the band intensities were quantified using the Image J program.
In silico studies
The structure of nNOS (PDB: 6NG1) and the reference drug, Rosiglitazone (Pub Chem ID 77999) was downloaded from the RCSB protein Data Bank and Pub Chem Database. The chemical structure of title compound was prepared using Chem Bio Draw; the energy minimization was carried out using Argus lab and converted into Pdbqt file format. Molecular docking studies were carried against nNOS proteins with the compound, EGCG and the reference drug Rosiglitazone, using the docking module implemented in Pyrx2010.12. The grid dimensions were predicted as ˚ X: 28.27, Y: 27.13, Z: 28.51 respectively. The docking was carried out with the default parameters i.e., placement: triangle matcher, recording 1: London dG, refinement: force field and a maximum of 10 conformations of each compound were allowed to be saved in a separate database file in a mdb format. The binding energy and binding interactions of the protein–ligand complexes were determined using PyMol viewer tool by following the method 26 (www.pymol.org).
In silico ADME properties of the Ligands
The ligands (EGCG and RTG) were subjected to prediction of ADME (Absorption, Distribution, Metabolism and Excretion) properties. The various ADME properties including topological polar surface area (TPSA), molecular weight, number of rotatable bonds, molecular volume, number of hydrogen bond donors, and number of hydrogen bond acceptors, mi Log P and violations of Lipinski rule were calculated. Pre-ADMET online server (http://preadmet.bmdrc.org/) tool has been used to determine the ADME properties of the EGCG and RTZ. 27
Histopathological Examination
Paraffin blocks were prepared with brain tissue samples, fixed in 10% neutral buffered formalin solution after routine tissue monitorization process. From each tissue sample, 5µm thick sections were obtained, and these tissue sections were stained with haematoxylin and eosin. 28
Statistical analysis
Student “t” test and one-way ANOVA were used to determine the significance among parameters between the groups. Pearson correlation coefficient and Regression analysis were done using Graph Pad Prism version 6.01 for Windows. P ≤ 0.05 and P< 0.01were considered as statistically significant.
Results
Biochemical profile in brain
In-vitro antidiabetic activity, fasting blood glucose, and glycogen levels
The results of the present study (Figure 1) indicated that the inhibition of α-glucosidase enzyme activity analysis by different concentrations of green tea extract. The percentage of inhibition was increased with the increasing concentration of the extracts of green tea. The results were compared with standard drug ascarbose, which showed highest α-glucosidase inhibitory activity compared to the extracts of green tea tested. Effect of different concentrations extracts of green tea on inhibition of α-amylase is shown in Figure 2. In the present study, ascarbose and green tea extract exhibited inhibition of α-amylase enzyme in dose-dependent manner. The hiked fasting blood glucose levels with significant difference was reported in all experimental groups in comparison with normal control rats during 1st week, 4th week, and 8th week. The daily administration of GTE to diabetic alcoholic rats for 60 days caused a significant (P <0.05) reduction in fasting blood glucose (FBG) and an increase in body weights. A significant change in the levels of glycogen is observed between the AC, DC and D+A rats in comaparision with NC rats. But D+A+E rats showed a significant decrease with AC and D+A rats and no significance either with NC or DC rats.
Effects of alcohol and diabetes on body weight and brain weight
Data demonstrated (Figure 2) that the percentage of brain weight/body weight exhibited significant decrease in DC, D+A, D+A+E and significant decrease in the percentage of brain weight/body weight in comparison with the normal control rats. There is no significant difference between DC, D+A and D+A+E with normal healthy controls rats. All experimental groups except D+A+E showed diminished body weight and brain weight with significant difference. Supplementation of EGCG to the D+A+E showed a significant increase in the weights of body and brain at the end of the experimentation period.
Status of nitroxidative stress markers, antioxidant enzymes and signalling molecules
Our results presented that an augmented level of malondialdehyde, protein carbonyls, peroxynitrites, and nitric oxide was observed in all experimental groups (AC, DC, D+A, D+A+E). A significant decrease was noticed among alcohol administered diabetic groups studied in comparison with normal controls and other studied groups (AC, DC, and D+A+E). The mean values of malondialdehyde showed significant change between experimental groups except D+A+E rats (Figure 3). Data shown in Figure 4 that significantly diminished concentrations of reduced glutathione content, and antioxidant enzymes (GPx, SOD, and CAT) activities in all studied group rats and significant change was reported among experimental groups except levels of reduced glutathione.
In the current study, all experimental rats demonstrated significant increase in the expression levels of Bcl2, Bax, caspase 3, COX2, TNF-α, and IL-6 compared to controls rats. The mean values of COX2 and caspase 3 showed significant difference and remaining variables (Bcl2, Bax, IL-6, and TNF-α) did not showed significant change in D+A+E rats. There is no significant change between AC and DC group rats in the levels of Bcl2, COX2, and TNF-α, while significant difference was noticed in the mean values of Bax, IL-6, and caspase 3. The D+A+E rats showed a significant difference in the expression levels Bcl2 and Bax with NC, AC, DC and D+A rat groups but not with NC rats. And these D+A+E rats showed a DC and D+A rats but not with NC an AC rats. Similarly, they are significantly different in the expression of TNF-α with the D+A rats but not with the NC, AC and DC rats as well. But D+A+ E rats are statistically significant in expressing the COX2 and caspase 3, with all the other groups viz., NC, AC, DC and D+A rats (Figure 5, Figure 6).
Levels of bioamines
Our results noticed (Figure 7) that, the levels of dopamine and norepinephrine were higher in AC, DC, and D+A compared to control rats. The mean values of dopamine exhibited significant difference among experimental groups and D+A groups showed statistical significant change with the other groups in the mean values of norepinephrine. A significant reduction in the levels of serotonin and tryptophan was reported in studied groups (AC, DC, and D+A) in comparison with healthy rats. The D+A rats showed significant change with remaining all groups and there is no significant difference between AC and DC groups.
Data (Figure 8, Figure 9) indicated the range of retention time of standard nor epinephrine is 3.5-5.4 min, serotonin is 3.6-6.2 min, and 3.8-9.2 min respectively and appeared a chromatogram peak at 4.01 min of nor epinephrine, 5.34 min of dopamine, 6.57 min of serotonin respectively. The group I rats reported that chromatogram peak at retention time at 4.99 min of nor epinephrine, at 5.40 min of dopamine, at 6.26 min of serotonin. The chromatogram peak at 5.77 min of nor epinephrine, at 6.10 min of dopamine, at 6.90 min of serotonin was observed in group II rats. The nor epinephrine shown peak at retention time at 4.99 min of nor epinephrine, at 5.40 min of dopamine, at 6.26 min of serotonin in group III rats. The chromatograms of nor epinephrine, dopamine, and serotonin at 4.39 min, 5.14 min, and 5.91 min respectively in the brain tissue of group IV rats. In the brain tissue, nor- epinephrine disclosed a chromatogram peak at 4.50 min of retention time, dopamine at 5.04 min, and serotonin at 6.46 min in group V rats.
Histopathology
Photomicrographs of rat brain sections in different experimental groups stained with Hematoxylin and Eosin (10X), (a) Histopathological sections of brain in control rat revealed normal cellular structure with normal astrocyte and glial cells, (b,d) Rat treated with and alcohol administered diabetic rat respectively, showing cellular structure with reduced number of astrocytes and glial cells, (c) STZ induced diabetic control rat revealed decreased astrocyte number and brain alterations, and (e) Brain of rats treated with GTE (300 mg/kg.b.w) after induction of diabetes to the alcohol treated rats , showed restoration in glial and astrocyte number to compare with normal control rats (Figure 10).
Docking studies
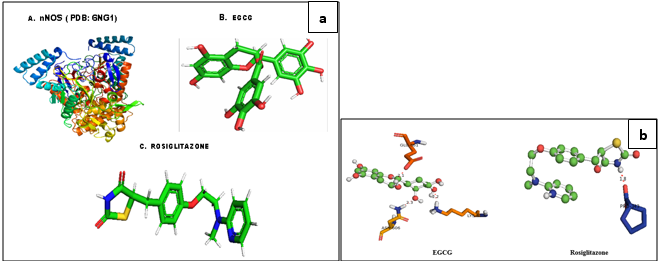
The binding affinities and energy profiles of both title and reference compounds towards the active site of the enzyme are summarized in Table 1. The present investigation demonstrated that the title compound will be the promising next generation anti-diabetic drug, which can be effectively used in the treatment of manifestation of diabetic complications. The 3D bonding images of the compounds were shown in Figure 11. Meanwhile, the molecular docking study demonstrated that EGCG is able to strongly interact the nNOS protein with a high binding affinity (-6.4 kcal/mol) via strong hydrogen bindings to Asn 606 and glutamic acid 661 and a hydrophobic interaction to the hydrophobic pocket of Lysine 631. The strong interaction predicted between EGCG to nNOS may lead to inhibition of nNOS by EGCG, thus supporting the down regulation of it was observed in this study (Figure 11 a,b).
ADMET
We have determined the compliance of the ligands to the Lipinski’s ‘rule of five’. According to this rule, poor absorption or permeation is more likely when there are more than five hydrogen bond donors, ten hydrogen bond acceptors, the molecular weight is greater than 500 and the calculated log p (logarithmic ratio of the octanol–water partitioning coefficient) is greater than 5. Molecules violating more than one of these parameters may have problems with bioavailability and a high probability of failure to display drug-likeness. Further, the topological polar surface area (TPSA) which is another key property in estimating drug bioavailability was also calculated. Generally, compounds with a TPSA ≥140A° are thought to have low bioavailability. As shown in Table 2, the compound (EGCG) complies with these rules. Moreover, the EGCG exhibited a greater percentage of absorption (%ABS) with 98.66% whereas the RTZ is with 90.66%. Hence, theoretically, this compound should have good passive oral absorption and drug likeness. In addition to this, different ADME predictions such as BBB penetration, percentage of human intestinal absorption (HIA %), CaCO2 permeability and percentage of plasma protein binding (PPB %) were predicted. Analysing the ADME predictions (Table 3), it was observed that the compound has shown high HIA% values with 99.24 % and is well absorbed when compared to the RTZ (94.16%). The CaCO2 cell permeability value of the EGCG is good, that is 25.14 nm/s. Furthermore, the compound was strongly bound to plasma proteins with %PPB penetration more than 94 %. In addition, it was found to have good penetration (0.226) to the CNS through the BBB. From all these parameters, it can be observed that, theoretically, this compound exhibited good absorption and bioavailability with good permeability through the BBB when compared with the reference compound, RTZ.
Table 1
Bonding characterization of EGCG and RTZ againstnNOS protein
Table 2
Physicochemical properties of EGCG and RTZ
Table 3
Prediction of pharmacokinetic properties of EGCG and RTZ
|
Compound |
CaCO2a permeability |
HIAb (%) |
PPBc (%) |
BBBd (Cbrain/Cblood) |
|
EGCG |
25.14 |
99.24 |
94.16 |
0.226 |
|
RTZ |
20.80 |
94.16 |
90.28 |
0.620 |
Table 4
Primer sequence of related genes
Figure 1
Effect of aqueous green tea extract on alcohol induced alterations in percentage of α-amylase, α-glucosidase inhibition (a, b), fasting blood glucose (c) and glycogen levels (d) of diabetic brain. Data are expressed as mean ± SEM. Superscript of different letters in each column differ significantly (P < 0.05) from each other. Group-NC: Normal control rats, Group-AC: Alcohol control rats, Group-DC: Diabetic control rats, Group-D+A: Diabetic rats administered with alcohol (5 g/kg.b.wt), and D+A+E: Alcohol administered diabetic rats treated with GTE (at 100, 200 and 300mg/kg.b.wt.) respectively.
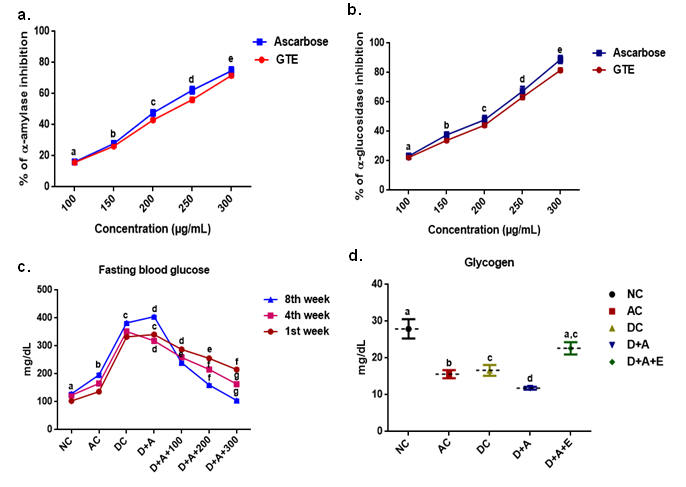
Figure 2
Effect of aqueous green tea extract on alcohol induced alterations in brain weight (a), body weight (b) and the percentage change in the ratio of brain to body weight (c) of diabetic rat. Data are expressed as mean ± SEM. Superscript of different letters in each column differ significantly (P < 0.05) from each other. Group-NC: Normal control rats, Group-AC: Alcohol control rats, Group-DC: Diabetic control rats, Group-D+A: Diabetic rats administered with alcohol (5 g/kg.b.wt), and D+A+E: Alcohol administered diabetic rats treatedwithGTE(300mg/kg.b.wt)respectively.
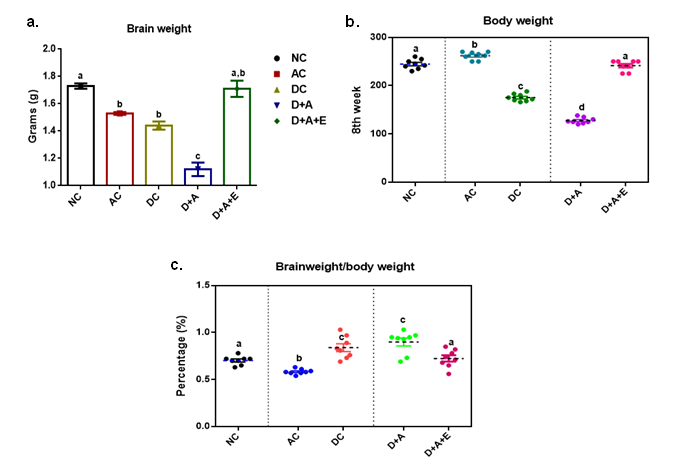
Figure 3
Effect of aqueous green tea extract on alcohol induced alterations in nitroxidative stress markers like lipid peroxidation (a), protein carbonyls (b), peroxynitrites (c) and nitric oxide (d) of diabetic rat brain. Data are expressed as mean ± SEM. Superscript of different letters in each column differ significantly (P < 0.05) from each other. Group-NC: Normal control rats, Group-AC: Alcohol control rats, Group-DC: Diabetic control rats, Group-D+A: Diabetic rats administered with alcohol (5 g/kg.b.wt), and D+A+E: Alcohol administered diabetic rats treated with GTE (at 100, 200 and 300mg/kg.b.wt.) respectively.
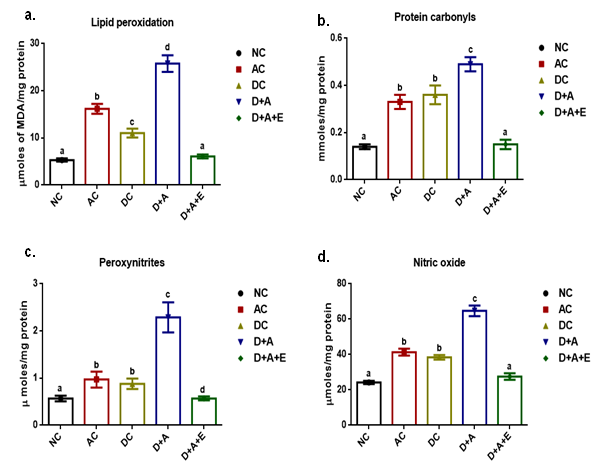
Figure 4
Effect of aqueous green tea extract on alcohol induced alterations in antioxidant status like reduced glutathione (a), glutathione peroxidise (b), superoxide dismutase (c) and catalase (d) of diabetic rat brain. Data are expressed as mean ± SEM. Superscript of different letters in each column differ significantly (P < 0.05) from each other. Group-NC: Normal control rats, Group-AC: Alcohol control rats, Group-DC: Diabetic control rats, Group-D+A: Diabetic rats administered with alcohol (5 g/kg.b.wt), and D+A+E: Alcohol administered diabetic rats treated with GTE (300mg/kg.b.wt) respectively.
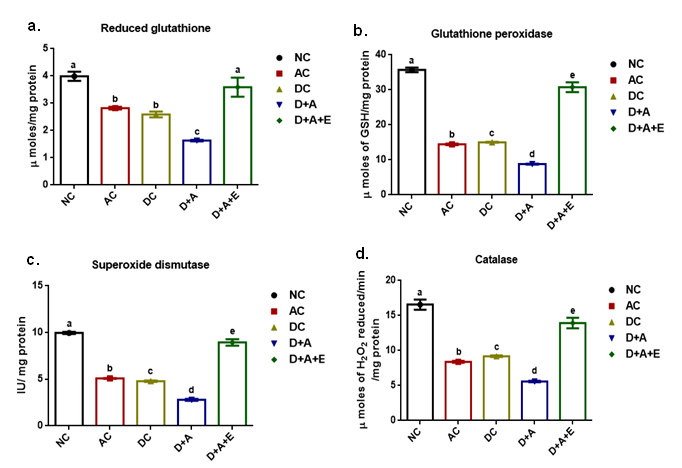
Figure 5
Effect of aqueous green tea extract on alcohol induced alterations in the gene expression levels of Bcl2 (a), Bax (b), ratio of Bcl2/Bax and IL-6 (d) of diabetic rat brain. Data are expressed as mean ± SEM. Superscript of different letters in each column differ significantly (P < 0.05) from each other. Group-NC: Normal control rats, Group-AC: Alcohol control rats, Group-DC: Diabetic control rats, Group-D+A: Diabetic rats administered with alcohol (5 g/kg.b.wt), and D+A+E: Alcohol administered diabetic rats treated with GTE (300mg/kg.b.wt) respectively.
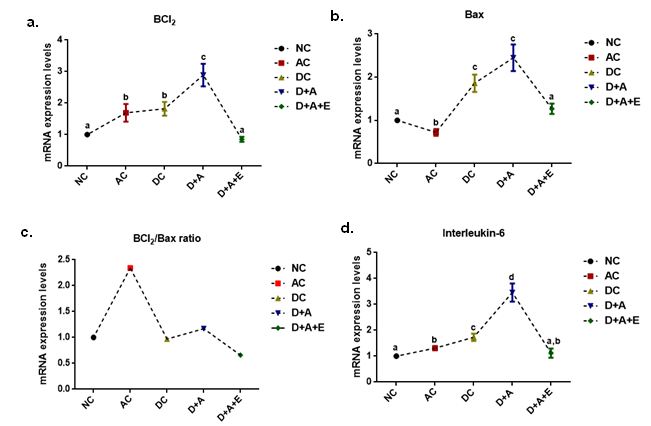
Figure 6
Effect of aqueous green tea extract on alcohol induced alterations in the gene expression levels of TNF-α (a), COX2 (b), and Caspase-3 (c) of diabetic rat brain. Data are expressed as mean ± SEM. Superscript of different letters in each column differ significantly (P < 0.05) from each other. Group-NC: Normal control rats, Group-AC: Alcohol control rats, Group-DC: Diabetic control rats, Group-D+A: Diabetic rats administered with alcohol (5 g/kg.b.wt), and D+A+E: Alcohol administered diabetic rats treated with GTE (300mg/kg.b.wt) respectively.
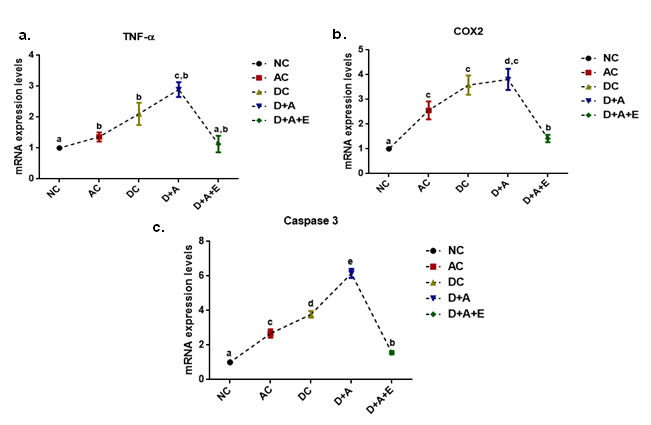
Figure 7
Effect of aqueous green tea extract on alcohol induced alterations in the levels nor-epinephrine (a) dopamine (b), tryptophan (c), and serotonin (d) in plasma of diabetic rats. Data are expressed as mean ± SEM. Superscript of different letters in each column differ significantly (P < 0.05) from each other. Group-NC: Normal control rats, Group-AC: Alcohol control rats, Group-DC: Diabetic control rats, Group-D+A: Diabetic rats administered with alcohol (5 g/kg.b.wt), and D+A+E: Alcohol administered diabetic rats treated with GTE (300mg/kg.b.wt) respectively.
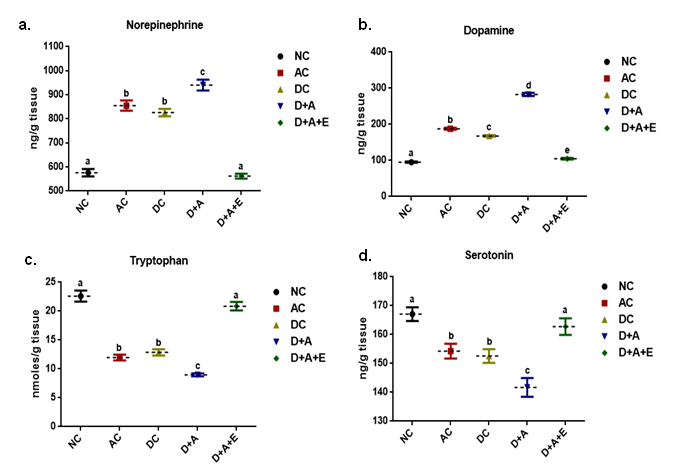
Figure 8
HPLC chromatograms of standards taken to evaluate the level of various biogenic amines like Epinephrine (a), Dopamine (b) and Serotonin (c) in the brain of normal control rats vs. other experimental groups.
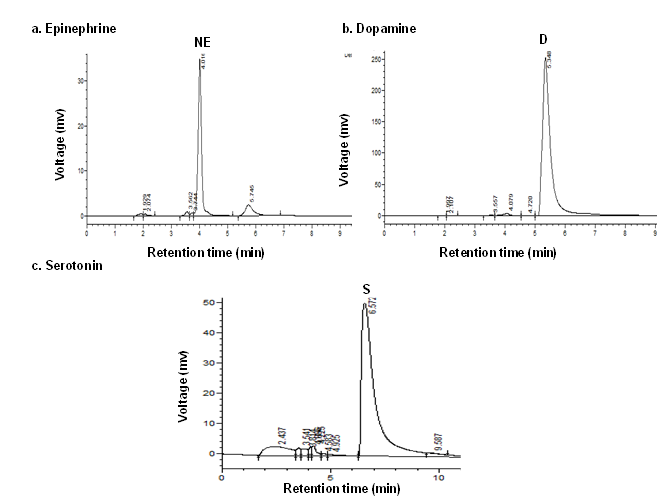
Figure 9
HPLC chromatograms showing the effect of green tea extract on alcohol induced alterations in the levels of nor-epinephrine (NE), dopamine (D), and serotonin (S) in plasma of diabetic rats. Data are expressed as mean ± SEM (P < 0.05). Note: NC: Normal control rats, AC: Alcohol control rats, DC: Diabetic control rats, D+A: Diabetic rats administered with alcohol (5 g/kg.b.wt), and D+A+E: Alcohol administered diabetic rats treated with GTE (300mg/kg.b.wt) respectively.
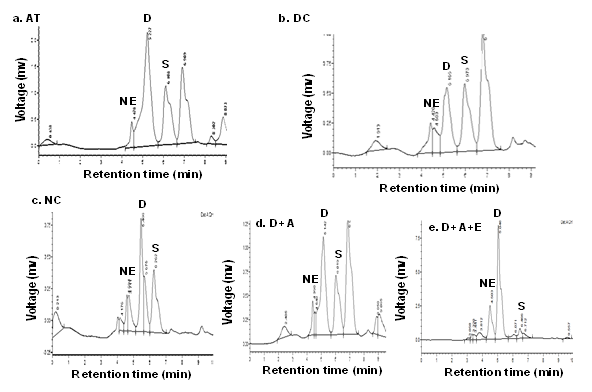
Figure 10
H& E (x40) stained Light micrographs showed resting morphology with lightly stained cell bodies, having of Glial cells and astrocytes in Normal Control rats (a) while the images of Alcoholic Control rats (b) and diabetic control rats (c) depicting the increased number of astroglial cells with dense processes and the brain image of Alcohol administered diabetic rats (d) showed a profound increase in the astroglial cells with wavy and fragmented processes ( Blue arrows) that were consistent upto the 8th week of experimentation duration but Alcohol administered diabetic rats treated with GTE (e) after the duration of 8 weeks, showed a decreased number of astrocytes and glial cells and which were restored to the levels of normal control by the supplementation of GTE for a period of 8 weeks.
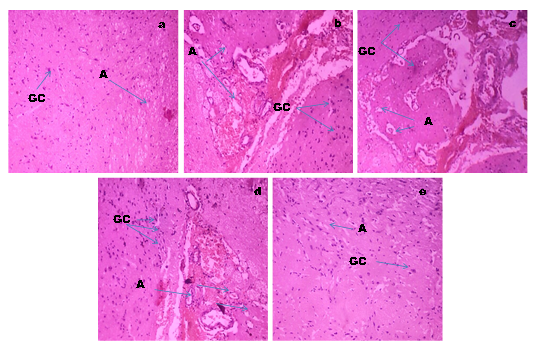
Figure 11
a: Molecular structures of nNOS, EGCG and Rosiglitazone; b: Predicted bonding interactions between the title compound with ASN 606 (Yellow); GLU 661 (red) and LYS 631 (orange) and standard with PRO 343 (blue) of nNOS. Position of EGCG were showed in the hydrophobic pocket of nNOS and nNOS has deep hydrophobic grooves suitable for the binding of EGCG.
Discussion
The present study used a dose of 5g/kg. b. w/day alcohol (20% v/v) that has been proved to be neurotoxic as it selectively increased nitroxidative stress in diabetic rats. Comorbid existence of diabetes and alcoholism worsen health status, productivity and other societal costs. The current study examined the effects of GTE on nitro/oxidative stress in brain of alcohol treated diabetic rats. Diabetes causes dysregulation of various metabolic processes, especially the glucose homeostasis. In addition, neurobiological profiles of alcoholism are linked to the effects of a disruption of glucose homeostasis and of insulin resistance, which are affected by altered appetite that regulates the peptides and neurotrophic factors.29 Heavy alcohol consumption increases ROS production and may be a mechanism of pancreatic β-cells dysfunction in type 2 diabetes mellitus. Glucose metabolism play an important role related in neuroenergetics, neurotransmission, energy storage, biosynthesis and oxidative defence. Thus, tight regulation of glucose metabolism is critical for normal brain physiology.30 The damage caused by alcohol abuse and diabetes can become debilitating and cumulative.
Hyperglycemia generates abnormally high levels of free radicals by auto-oxidation of glucose and by protein glycation, that are also participate in the development of oxidative stress and the inflammatory status.31 Hence, it was found to be very difficult to manage and cure this disease effectively by using the available oral hypoglycaemic drugs or insulin. Therefore, the focus of scientists shifted towards the development of the natural herbal medicine with high therapeutic potential and less or no toxic effect. In this connection, the aqueous extract of green tea leaves have been claimed to possess anti-diabetic properties by traditional healers.32 In the present study, we evaluated the α-glucosidase and α-amylase inhibitiory activity and antidiabetic activity of the GTE in alcohol treated diabetic rats. α– Gluocosidase and α–amylase are the carbohydrate hydrolyzing enzymes involved in the digestion of carbohydrates. Ascarbose, an oral hypoglycemic agent which inhibits both α–amylase and α– Glucosidase was used as standard.33 The aqueous extract of green tea inhibited the activities of both enzymes in dose dependent manner. The antihyperglycemic activity of the aqueous extract of green tea could be due to the active phytoconstituents present in the extract which competitively bind to the oligosaccharide binding sites of the enzyme there by preventing the hydrolysis as indicated by our in vitro α– gluocosidase and α–amylase activity. Different doses (100, 200 and 300 mg/kg.b.w) of aqueous GTE was administered to check its anti-diabetic activity in alcohol treated diabetic rats. After the treatment, it was found to decrease the fasting blood glucose levels significantly with the concentration of 300mg/kg.b.w, at the end of 8 weeks. Highest anti-diabetic activity at these concentrations could be due to the bioactive compounds present in the extract that might improve the insulin secretion or mimic the insulin action. Treatment with aqueous GTE has lowered the blood glucose concentrations to normal levels in D+A rats as compared to the diabetic controls.
Glycemic equilibrium plays a very important role in the prooxidant/antioxidant balance. A critical biomarker of oxidative stress is lipid peroxidation and nitrosative stress is peroxynitration which are the most explored areas of research when it comes to ROS/RNS34 respectively. Involvement of oxidative/nitrosative stress in alcohol abused diabetic complications is the basis of the development of adjunct therapies with antioxidant. Alcohol and diabetes produces disturbances in the lipid profile making the cells more susceptible to lipid peroxidation, and protein nitration, critical biomarkers of nitroxidative stress, finally leading to the alterations in the levels of membrane lipid composition. Our results showed significantly increased lipid peroxidation product, MDA and protein carbonyl levels of brain in chronically alcohol treated diabetic rats. Membrane proteins are important targets for oxidative/nitrosative attack because ROS/RNS might cleaves multiple bonds, oxidizes amino acid residues, augments fragmentation and aggregation of proteins and the rate of proteolysis.35 Thus protein oxidation is considered one of several alcohol-related modifications by ROS. Increased protein carbonyl levels are a major index of protein oxidation. There have been a relatively small number of reports that systematically dealt with identification and functional characterization of nitrated proteins in various sub cellular organelles, including mitochondria, especially under conditions with increased nitroxidative stress. Peroxynitrite, a product of superoxide anion radical reaction with nitric oxide, is a major oxidant in pathological conditions associated with oxidative stress including diabetes36 and preventing peroxynitrite formation could be an effective target for the treatment of diabetic neuropathy. 37 Production and accumulation of ROS/RNS caused loss of membrane integrity and function due to increased membrane peroxidation and nitration. Our results showed significantly augmented the levels of MDA and protein carbonyls, nitric oxide and peroxynitrite of brain of D+A+E rats in comparison with DC and AC rats. Reduced glutathione (GSH), an important endogenous non-enzymatic antioxidant was decreased in diabetic brain by chronic alcohol exposure, and this may influence the basal levels of other antioxidant enzymes in the brain of diabetic rats.
Brain is more vulnerable to nitroxidative damage than any other organ in the body as it consumes nearly 20% of oxygen from the body, has low concentrations of antioxidants and high content of polyunsaturated fatty acids and catecholamines that are easily oxidised.38 Experimental studies show that polyunsaturated fatty acids in cell membrane are extremely prone to attack by free radicals due to the presence of multiple bonds.39 Diabetes and alcoholism induces alterations in activity of enzymes GPx, SOD and CAT. Any alteration in their levels will make the cells prone to oxidative stress and hence cell injury. Glycogen levels differ enormously from one tissue to another. The factors which maintain the characteristic level in a given tissue are unknown.40 Ethanol is known to perturb the carbohydrate metabolism and alter the content of glycogen, a highly branched polysaccharide represents the major energy store in the brain.41 At the end of experimental period, brain glycogen concentrations were reduced by alcohol, in alcohol treated diabetic rat groups that may contributed to changes in the phosphorylation rate of glycogen synthase. Altogether, the present results indicate that diabetes with alcohol abused condition is associated with impaired brain glycogen metabolism. To our knowledge, this is the first study to report glycogen levels in an alcohol treated diabetic animal model. Furthermore, these alterations were restored to the normal by supplementation of green tea extract. Alcohol selectively affects nNOS activity in different brain cells. Alterations in the nNOS gene may constitute a genetic risk factor for the vulnerability of high voluntary alcohol intake and subsequent alcohol dependence.42 Western blotting showed a significant increase in the expression of nNOS in diabetic rat brain after the treatment with alcohol. These findings indicated that an impairment of nNOS expression is mainly due to the absence of insulin and alcohol may exert its toxic effects via a mechanism of altered nitric oxide availability from nitric oxide synthase.43
Reversion by GTE treatment was also obtained in the protein expression of nNOS, which could be due to catechins that inhibits the enzyme activities by binding to the active site nNOS, and thus decreasing the percentage of its active dimeric form, reducing the enzymatic coupling and affecting the RNS generation during the reaction. The synthesis of a number of neurotransmitters involved in the regulation of various physiological functions and behavioural patterns depends largely on precursor availability. Bcl-2 and Bax proteins, are functionally opposed and hence, in this study, we therefore assessed the expression of Bcl-2 and Bax at mRNA level as well as the Caspase-3, in order to investigate the occurrence of apoptosis in the brain of alcohol treated diabetic rats. In the present study, we observed that, chronic alcohol administration significantly increases the magnitude of anti-apoptotic Bcl2 and apoptotic Bax mRNA in the D+A rat brain which was coupled with increase in caspase-3 activity, IL-6, TNF-α, and COX2, suggests the role of cytokines in alcohol-induced neuroinflammation under diabetic condition. Increased blood-glucose level as observed in this study and activation of p53 transcription factors and caspase 3 might be the potential causes to reduce the IGF-I level and sequential apoptotic cell death in the STZ-induced diabetic brain following alcohol treatment as reported in this study. Results found that green tea catechins especially EGCG, a potent inhibitor of the anti-apoptotic proteins attenuated the enhanced levels of pro-inflammatory cytokines to normal, which are in accord with earlier reports.44 Therefore, mechanism underlying the neuroprotective effects observed in our study might be due to its antioxidant, anti-inflammatory and neuro-modulatory effects of EGCG. In diabetic animals treated with alcohol, the basal brain concentrations of serotonin were decreased and those of norepinephrine and dopamine were increased compared to alcohol and diabetic controls. Since uptake of the precursor’s tryptophan and tyrosine from the blood is chronically reduced, it is likely that long-term adjustments of neurotransmitter metabolism occur in the diabetic brain.45
Glial cells are susceptible to any change or disruption in the brain. In response to adverse state, glial cells transform their morphology and proliferate to combat the baleful condition.46 Following any brain insult, glial cells get activated and exhibit morphological transformations from resting to activated, increase in their cell population and secrete an array of inflammatory molecules.47 In the current study, hematoxylin and eosin stained alcoholic, diabetic and alcohol treated diabetic brain presented a marked increment in activation and population of astrocytes and glial cells at the end of 8th week. This activation might be a customized approach to modulate the effect of excessive cell death following diabetes under alcoholism and moreover, these astrocytes in the healthy brain regulate neurotransmitter and neurovascular dynamics as well which has been demonstrated to be disturbed in alcohol treated diabetic rats and in turn improved by the treatment with GTE. Meanwhile, molecular docking analysis was carried out for the title compound with selective pharmacological target such as nNOS, which is a suitable target for anti-diabetic activity. The docking results revealed that, the compound EGCG has shown higher binding energy than the reference drug, Rosiglitazone. Interestingly, raw brain-to-body weight ratio is an important and useful tool for comparing encephalization within species or between closely related species. Recent studies have been demonstrated that increased brain insulin sensitivity is associated with the loss of weight during lifestyle intervention and also linked with the distribution of body fat.48
Conclusion
With the above results, we concluded that, the interplay between alcohol and diabetes provided the prolonged and persistent hyperglycemia, nitroxidaive stress, reduced antioxidant status in addition to the glial activation and thus cellular degeneration. And also concluded that apoptosis plays a vital role in the alcohol exacerbated diabetic pathogenesis possibly by increasing the ratio of Bcl2/Bax along with the caspase-3, that might in turn facilitates the memory and cognition deficits. This study also revealed that, the ameliorative approach of EGCG could be seen in the down regulation of nNOS, a major causative of nitroxidative stress. Additionally, the molecular docking results confirmed that, the compound EGCG, showed a higher binding affinity and energy than the reference drug and hence, 300 mg/kg.b.w of EGCG has been proved as better prospective and veritable source that offers an therapeutic approach for the treatment of alcohol abused complications in diabetes.
