Introduction
Accurate diagnosis and grading of brain tumors is crucial as the management and prognosis of different grades of tumors is different.1 Pathological analysis of biopsy samples is the current gold standard for tumor grading. However, common potential pitfalls in neuropathology must be considered, such as the possible under sampling of a heterogenous glioma, which could lead to underestimation of the tumor grade2 and the possible difficulty to obtain a range of samples if the tumor is inaccessible to the neurosurgeon based on the location. Recent advances in the treatment of cerebral gliomas have increased the demands of non-invasive neuroimaging for the diagnosis, therapeutic planning, tumor monitoring, and patient outcome prediction. Magnetic resonance imaging (MRI) and computed tomography (CT) can display the anatomical appearance of brain tumor, but fails to provide physiologic and functional information that is crucial for tumor grading, predicting clinical outcome and response to therapy.3
Diffusion Tensor Imaging (DTI), a step further ahead in advanced MRI-based neuroimaging techniques, makes it possible to estimate the magnitude, orientation, and anisotropy of the brain's white matter tracts. Diffusion imaging examines the motion of water molecules, which is normally Brownian in the unimpeded, isotropic state. DTI takes advantages of the preferential diffusion of water in brain tissue, which is decreased perpendicular to the myelin sheaths and cell membranes of white matter axons.4 Various DTI metrics can be derived from the imaging data to provide information about the orientation and architecture of tissue microstructure at the voxel level.3 The most commonly derived DTI metrics are apparent diffusion coefficient (ADC) also known as mean diffusivity (MD) and fractional anisotropy (FA).5
Primary brain tumors are treated with a combination of surgery, radiation, and chemotherapy.6 The best treatment for an individual patient takes into account the tumor location, tumor grade, potential symptoms, and potential benefits versus risks of the different treatment options (modalities). Glioma grading is very important both in treatment decision and evaluation of prognosis.7, 8, 9 Current evidence supports a role for DTI in tumor grading and multimodal navigation during tumour surgery.
Aim
To analyse Diffusion Tensor Imaging metrics for glioma grading at 3T: comparison with histopathology as gold standard
Objectives
To assess the diagnostic accuracy of axial diffusivity (AD), radial diffusivity (RD), apparent diffusion coefficient (ADC), fractional anisotropy (FA), linear isotropy coefficient (CL), planar isotropy coefficient (CP) and spherical isotropy coefficient (CS) values derived from DTI for grading of glial tumors.
Sensitivity, specificity, positive and negative predictive values (PPV and NPV) and accuracy;
Assess the association between ADC, FA, AD, RD, CL, CP, CS derived from DTI metrics and tumor grade.
Predict range of different DTI metrics found in different grades of glioma.
Diffusion tensor imaging
Diffusion can be described as random thermic motion, or Brownian motion. Diffusion imaging examines the motion of water molecules, which is normally Brownian in the unimpeded, isotropic state.5, 10 The technique utilizes the fact that in tissue, diffusion is not necessarily random due to barriers that limit diffusion in one or more directions. Unhindered diffusion of water molecules is referred to as isotropic diffusion. Restriction of movement along only one axis is called anisotropic diffusion. Among others, the measured diffusion process depends on the applied magnetic gradients and the axis of myelinated white matter tracts.
Diffusion in White Matter (WM) is less restricted along the axon and tends to be anisotropic (directionally-dependent) whereas in Gray Matter (GM) is usually less anisotropic and in the Cerebrospinal fluid (CSF) is unrestricted in all directions (isotropic). Based on this assumption, Basser and colleagues (1994a,b) modelled the diffusion process by an ellipsoid, which can mathematically be represented by a 3×3 symmetric matrix, also known as tensor (hence DTI’s name origin).11
Technical and Biophysical Considerations of DTI
Various cellular structures—for example, cell membranes and intracellular organelles—impede the random motion of water molecules in the brain and instead cause them to move with some form of directionality called “anisotropy”.12, 13 This biological property is essential to understanding DTI, because the directionality of water molecules as they move within white matter tracts is a key component of fibre tracking.
The orientation of white matter tracts causes anisotropy, because water diffuses in a direction parallel to the axonal fibres as a result of the myelin sheaths, which create a barrier to the diffusion of water perpendicular to the axonal membranes. Collectively, this information is known as the “diffusion tensor,” a 3D ellipsoid model of water diffusion. The diffusion tensor directly represents the direction (anisotropy) of water and indirectly represents the orientation of white matter fibres. It is described as a 3D ellipsoid and is subjected to a linear algebraic procedure known as “diagonalization.” The diffusion tensor can then be represented by 3 Eigen values (l1 ≥ l2 ≥ l3), which are measures of the magnitude of diffusion, and subsequently by 3 eigenvectors (v1, v2, v3), which are orthogonal to each other and represent the direction of diffusion.7 So the basic concept behind DTI is that water molecules diffuse differently along the tissues depending on its type, integrity, architecture, and presence of barriers, giving information about its orientation and quantitative anisotropy.
DTI metrics
With DTI analysis it is possible to infer, in each voxel, properties such as the molecular diffusion rate [Mean Diffusivity (MD) or Apparent Diffusion Coefficient (ADC)], the directional preference of diffusion [Fractional Anisotropy (FA)], the axial (diffusion rate along the main axis of diffusion), and radial (rate of diffusion in the transverse direction)diffusivity.8
Definitions of different DTI derived tensor metrics: ADC (apparent diffusion coefficient) is related to the integrity of the brain tissue.5 Also known as mean diffusivity (MD). In a MD or ADC map, all three eigen values of a voxel's tensor are simply averaged (or summed) to quantify the amount of diffusion.9
FA (fractional anisotropy is a measure of diffusion anisotropy that is derived from the standard deviation of the 3 eigen values, and ranges from 0 (isotropy) to 1 (maximum anisotropy).5
Axial (AD) and radial (RD) diffusivity are DTI parameters that represent diffusion properties along the axial and radial directions, respectively.5
A set of three metrics has been described that can be used to measure the directional dependence of diffusion: linear anisotropy (CL), planar anisotropy (CP), and spherical anisotropy (CS).3
The most commonly derived DTI metrics are apparent diffusion coefficient (ADC) also known as mean diffusivity (MD) and fractional anisotropy (FA).
Apparent Diffusion Coefficient
ADC (also known as MD) is related to the integrity of the brain tissue. 5 MD measures the magnitude of diffusion. Mean diffusivity is comparable and mathematically equivalent to the ADC in standard diffusion-weighted imaging. It is calculated as the mean of the 3 Eigen values, representing the directionally averaged diffusivity of water, which is affected by changes in the structure of brain tissue. 10, 7 Generally speaking, MD values are inversely correlated to FA values. High MD is expected in voxels with low anisotropy.8
ADC and gliomas
Tumor cellularity has been reported to be a major determinant of ADC values in brain tumors.14 As the ability of water molecules to diffuse within tissue in high-grade tumors decreases, ADC values decrease.5 It has been suggested that the regions with minimum ADCs reflect the sites of highest cellularity within heterogeneous tumors, and, therefore, these sites may be of diagnostic value in identifying high-grade tumor components.15, 16, 17 Sugahara et al hypothesized that if cell swelling restricts the motion of water in the interstitium and reduces the ADC value, the ADC of gliomas (except for the cyst/necrosis component) would be affected by tumor cellularity because most affected areas would be almost completely replaced by tumor cells: more highly cellular gliomas would have smaller interstitial space. In addition, through identification of the areas of highest cellularity with this technique, it might be possible to establish the grading of the gliomas, because cellularity is one of the most important factors for determining grade.
Fractional Anisotropy
Fractional anisotropy is the measurement of the tendency of water to diffuse in one direction (anisotropy), Fractional anisotropy is calculated from the standard deviation of the 3 eigen values, ranging from 0 (isotropy with 0 net direction) to 1 (maximum anisotropy along 1 eigenvector).18 This directionality is typically presented in a color-coded map or via fibre tractography whereby the colour hue indicates directionality and brightness is proportional to the FA.7 High FA values are expected in white matter tracts that move along a single axis, while low FA values are expected in free water areas such as ventricles.8
FA and gliomas
Mathematic indices such as fractional anisotropy (FA) derived from DTI data can imply microstructural integrity of brain tissue. However, measurements of FA for tumor grading may show conflicting results. Inoue et al. reported that the FA values of low-grade gliomas are significantly lower than those of high-grade by a threshold of 0.188, 19 while Goebell et al. showed low FA ratios in the tumor centres of both low-grade and high-grade gliomas. 20 In the peritumoral region, the T2-weighted hyperintense area surrounding the high-grade glioma, the FA value is typically reduced resulting from a combination of perifocal edema, tumor mass effect, and invasion of tumor cells. 21 Low-grade gliomas tend to deviate, rather than destruct or infiltrate the adjacent white matter. 22 Therefore, FA value is less reduced in low-grade gliomas. 23
Stadlbauer et al, in their study, concluded that FA is better than mean diffusivity for assessment and delineation of different degrees of pathologic changes (ie, TI) in glioma.24
Various studies using DTI have also found no difference in FA measurements in the peritumoral tissue of high-grade gliomas compared with minimally or non-infiltrating tumors such as metastases or meningiomas but have found differences in other parameters such as the visual appearance of the FA maps, mean diffusivity, and the magnitude of the principal eigen values. FA can be altered by changes in either the anisotropic or isotropic components of the tensor.
ADC and FA studies in glioma
From a clinical standpoint, FA values are lower and MD values are higher in damaged white matter when compared to healthy tissue. Depending on the specific condition, this is thought to be due to edema, axonal disruption, or a combination of the two.8
Previous studies have shown there is no significant difference in intra tumoral tensor measurements between gliomas and metastases, although one study found FA to be higher in glioblastomas when compared to metastases, and another study found apparent diffusion coefficient (ADC) within the tumors to be lower in gliomas than metastases.8
Studies have also been done to understand DTI patterns of white matter surrounding tumours. They considered the following DTI patterns of white matter surrounding the tumors: edematous, displaced, infiltrated and disrupted. The classification of such different patterns was based on the FA values and on the direction and integrity of the white matter tracts adjacent to the tumors.
White matter disruption by the tumour: isotropic or near isotropic diffusion so that tract is not identifiable on fractional anisotropy (FA) or directionally encoded colour maps.
Tumour infiltrated white matter tracts: reduction of FA (25%) with increased apparent diffusion coefficient (ADC) with abnormal colour hues not as a result of bulk movement.
Oedematous white matter tracts: reduction of FA (25%) with increased ADC with normal direction and location (i.e. colour hues) on directionally encoded maps. There is some doubt if this differs much from the infiltrated tracts described above.
Displacement of white matter tracts: normal or mildly decreased (25%) FA values compared with contralateral side, but alteration in either position or direction of fibres on directionally encoded colour maps.
Axial diffusivity(AD) and radial (RD) diffusivity
Axial (AD) and radial (RD) diffusivity are DTI parameters that represent diffusion properties along the axial and radial directions, respectively. 5
A set of three metrics has been described that can be used to measure the directional dependence of diffusion: linear anisotropy (CL), planar anisotropy (CP), and spherical anisotropy (CS). 3 Jiang L et al concluded that AD in the tumor zone and Cs and Cl in WM adjacent to edema provide additional information to better classify gliomas. 25 These metrics may be complementary to the traditional tensor metrics, such as ADC, FA, and MD.
Server et al(2014) in their study to assessed the diagnostic accuracy of axial diffusivity (AD), radial diffusivity (RD), apparent diffusion coefficient (ADC) and fractional anisotropy (FA) values derived from DTI for grading of glial tumors in 78 patients , estimated the correlation between DTI parameters and tumor grades. They found that ADC, RD and AD were useful DTI parameters for differentiation between low- and high-grade gliomas with a diagnostic accuracy of more than 90% and can be used as reliable non-invasive imaging markers in grading of gliomas. 5
Materials and Methods
Study Population
All patients diagnosed with glioma on conventional MRI/ MR perfusion imaging / MR spectroscopy and coming to the Radiology department for imaging were asked to participate in the study.
Sampling technique and sample size
Sample size
A study by Andrés Server a, Bjørn A. Graff b, Roger Josefsenc, Tone E.D. Orheimd et al showed that Adct, Adt, RDt, and glial tumor grade were strongly correlated with Pearson r = -0.739. Using this correlation value with an α = 0.5, Power = 80 % and δ = -0.30, we estimated the sample size using the sample size formula for single correlation. Based on these estimates the sample size was found to be 38. Sample size was estimated using Stata Version 13.
Consent
The protocol was explained to the patients in the language best understood by them and an informed written consent was obtained from all patients prior to the MRI examination.
Data collection method
38 consecutive cases fulfilling eligibility criteria were taken for study after taking informed consent. A detailed history regarding Demographic data and brief clinical history was recorded. Patients’ identifiers were removed from image data before analysis. Patient or relatives were informed that data collected would be used in a study and that issues related to confidentiality and anonymity would be taken due care of.
MRI DTI Imaging
Siemens 3T MAG TRIO A Tim Sys MRI machine was used to perform the MRI. Each patient was examined in the supine position. The following sequences with corresponding parameters were performed:
Image analysis
We transferred the diffusion tensor data to an independent workstation for post- processing using dedicated software. Circular ROI of approximately 30 mm² was placed on most solid and lowest signal intensity part of tumor on ADC maps, peritumoral edema corresponding to area adjacent to tumor (area of low signal intensity on T1 weighted images and high signal intensity on T2 weighted images) and normal appearing white matter in the corresponding contralateral hemisphere (which displayed no abnormal signal on T1 weighted or T2 weighted images, contact with grey matter was avoided). The ROIs were carefully placed to avoid cystic, necrotic and hemorrhagic regions which might influence DTI metrics values. ROIs were then automatically transfered to corresponding λ1, λ2, λ3 and FA maps. FA, ADC, AD, RD, Cp, Cs and Cl was obtained in each of these regions.
Data entry and statistical analysis
DTI parameters and tumor grades were analyzed statistically.
Data was entered in MS Excel, corrected for typographic errors and analysed using SPSS software version 20.
The results were re-arranged in MS Word. Graphical representation of the results was done using MS Excel.
The difference between means was compared using t-test and for non-parametric data we used Mann Whitney U test. Pearson’s correlation was calculated, the diagnostic test properties were assessed by Sensitivity, Specificity, Positive Predictive Value (PPV), Negative Predictive Value (NPV), Diagnostic accuracy and Area under the Curve (AUC). A P value of < 0.5 was considered as statistically significant.
Results and Discussion
Gliomas are the most common primary brain tumors, representing 80% of primary brain tumors.26 The study included 38 patients with glioma of which 13 patients had histologically verified grade II (9 low-grade astrocytomas, 1 oligodendrogliomas, and 3 oligoastrocytomas), 10 patients had histologically verified grade III (7 anaplastic astrocytomas and 3 anaplastic oligoastrocytomas), and 15 patients had histologically verified grade IV (glioblastoma multiforme).
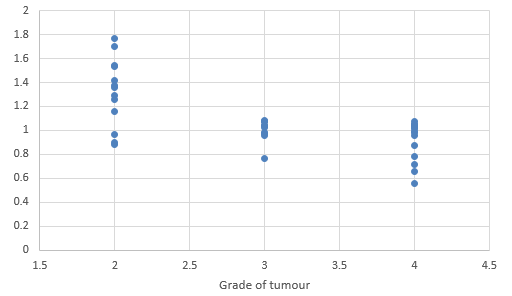
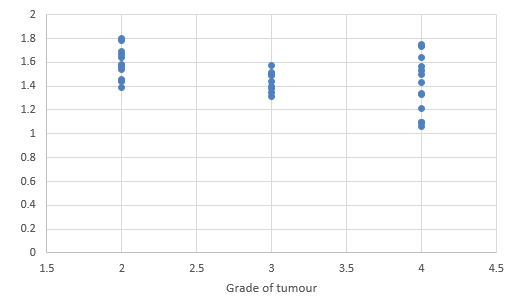
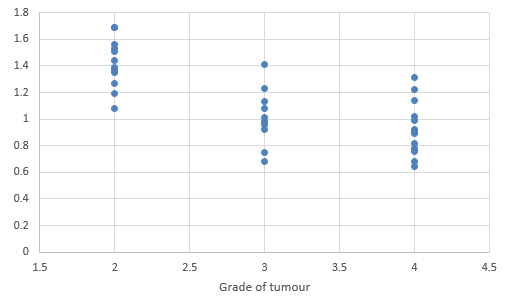
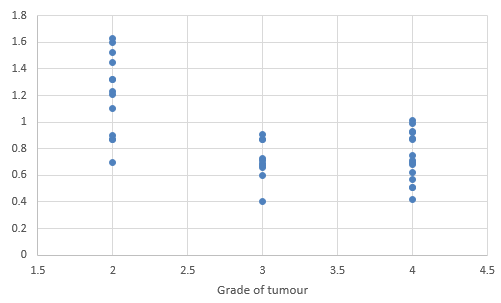
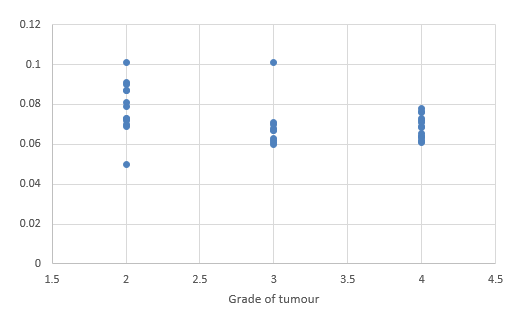
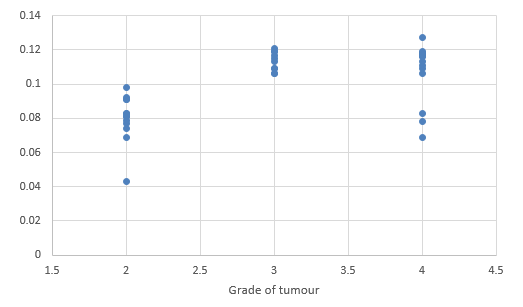
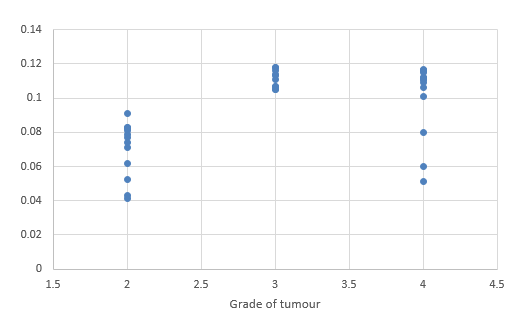
We compared DTI metrics using 21 parameters in our study. Scatter plots (1-7) summarize the correlation between tumor grades and DTI metrics. Overall, there was a strong, negative correlation between ADC(T), ADC (PT), AD (T), RD (T), CL(PT) and tumour grades and positive correlation between CP (T), CP (PT) and tumor grades. ADC (T), ADC (PT), AD (T), RD (T), CL (T) and CL (PT) values were significantly higher in low-grade gliomas compared with high-grade gliomas, except for the DTI CP (T), CP (PT) which was higher in the high grade (Table 5).
A significant difference with high CP (Table 5) value in the solid tumoral parts of high-grade gliomas was reported by Lee et al which was similar to our study.27
When comparing minimum FA (T), we found no difference between low- and high-grade gliomas, in accordance with other authors.5 This could be attributed to the fact that most high- grade gliomas arise from dedifferentiated lower grade ones.28 On the other hand, Inoue et al.,19 Kinoshita et al.,29 Beppu et al.,30 and Liu et al.31 found higher FA values in high grade gliomas compared with low-grade gliomas. While Inoue et al. reported that the FA values of low-grade gliomas are significantly lower than those of high-grade by a threshold of 0.188, 19 Goebell et al. showed low FA ratios in the tumor centres of both low-grade and high-grade gliomas. 20 A possible reason for these conflicting results could be the difference in the regions studied from the tumor. A study by Lee HY reported no significant differences in the FA ratios between high grade and low grade gliomas. 27 Another study added that higher anisotropic values within the solid parts of high-grade compared to low-grade gliomas may be attributed to the high cellularity of high-grade gliomas. 32
When correlating individual parameters with tumor grade, (Table 7) we found that AD (T) had the highest Pearson correlation factor at -0.73 followed by ADC (T) at -0.641. The other parameters like ADC (PT), CL (PT), CP (T) and CP (PT) were also found to be significantly associated. We found a significant negative correlation between all these factors except CP(T) and CP (PT). (Table 5) This finding was similar to a study done in Norway.
We used threshold values of ADC (T) = 1.115, AD (T) =1.075 and RD (T) = 0.930 as was reported in literature,5 to calculate sensitivity, specificity, NPV, PPV and Diagnostic Accuracy. (Table 6) The sensitivity and NPV of ADC (T) in our study was 100%, indicating that this parameter is an excellent tool for the discrimination of Low grade from high grades tumours.
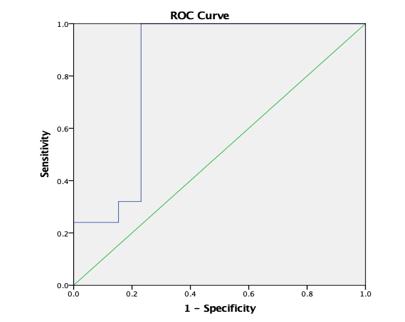
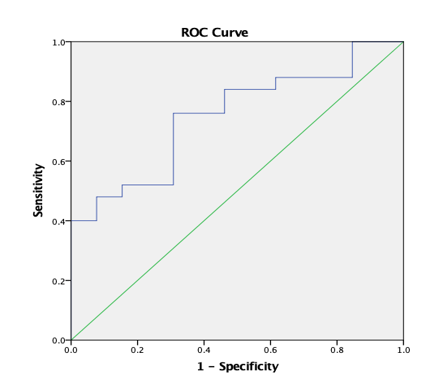
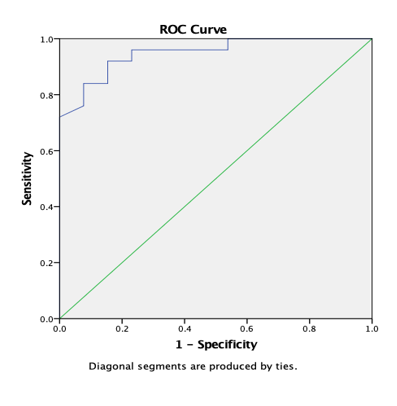
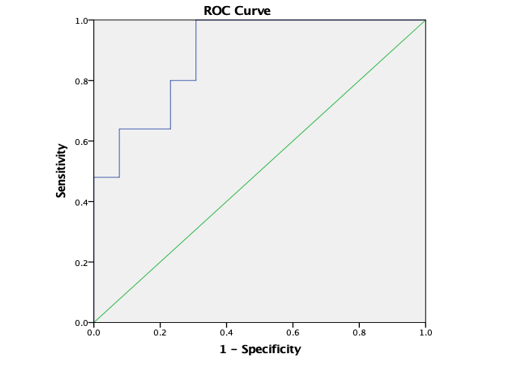
ROC analysis (Table 8) yielded AUC values of 83.1% for ADC (T) and 75.1% for ADC (PT) for discrimination of high grade from low grade tumours. AUC was 94.9% for AD (T), 88.9% for RD (T), 81.4% for CL (T), 80% for CL (PT) and 92% for CP (T) and CP (PT). In comparison, ADC (T), ADC (PT) and CP (PT) with a AUC of 95.7%, 69.4% and 73.4% was reported by El-Serougy L.26
ROC analysis yielded AUC values of 98.5% (ADCt) and 97.2% (ADCt/n) for distinguishing high grade from low grade tumours. 5
The cut off value of 1.078 for ADC (T) provided a sensitivity of 96% and specificity of 76.9% for differentiation of high grade from low grade tumors. (Table 9, Table 10) A Server et al. reports that the cut off value of 1.055 (10−3 mm2/s) for the minimum ADC (T) provided the best combination of sensitivity (100%) and specificity (94.4%) for discrimination of grade II from IV. Murakami et al.defined a threshold minimum ADC value of 1.01 and obtained sensitivity and specificity 83 and 91% respectively, in the differentiation between grade III versus grade IV tumors. 5
In the current study, RD (T) was a DTI parameter that enables distinction between High grade and low grades with a sensitivity of 100% indicating high true-positive and low false-negative rates. The high NPV, 100% for RD (T) is likewise a significant finding, as glial tumors with higher RD (>1.055) are unlikely to have high-grade components. A Server reports similar findings for a cut off of 0.930. 5
AD (T) was a DTI parameter that enables distinction between High grade and low grades with a sensitivity of 96% indicating high true-positive and low false-negative rates. (Table 9, Table 10) The high NPV, 90.9% for AD (T) is likewise a significant finding, as glial tumors with higher RD (>1.33) are unlikely to have high-grade components. A Server reports similar findings for a cut off of 1.225. 5
CP (Peritumoral) with a sensitivity of 68.4%, 81.3%, AUC of 72.4% was reported by El-Serougy L for a cut off of 0.32. 26
A diagnostic accuracy of 92.1% was obtained for ADC (T) (Cut off 1.115). (Table 6) Predicted range of cut off values also revealed diagnostic accuracy of 89.47% for ADC (T), AD (T), RD (T) and CP(T). (Table 9, Table 10) Another study added that ADC, RD and AD are useful DTI metrics for the differentiation between low-grade and high-grade gliomas with a diagnostic accuracy of more than 90%, and can be used as non invasive reliable biomarkers in the grading of gliomas. 5
As seen in our study as well as various previous studies including one by Ma L et al, it can be seen that rather than individual DTI metrics, combined DTI metrics can function in effect as a non-invasive measure to distinguish between low-grade and high-grade gliomas.33
However, our findings do indicate that it may be advantageous to switch from the commonly used DWI protocol that only allows for the extraction of the ADC/MD, to a DTI protocol that also yields the AD. With current state-of-the-art scanners, this can be realized without significantly increasing the measurement time.
Table 1
Distribution of Type of tumours found in the study subjects.
For statistical purposes all astrocytic, oligodendroglial, and oligoastrocytic tumors were categorized as low-grade tumors (diffuse astrocytomas, oligodendrogliomas, or oligoastrocytomas, WHO grade II) and high-grade glial tumors (anaplastic astrocytomas or anaplastic oligoastrocytomas, WHO grade III, and glioblastoma multiforme, WHO grade IV).
Table 2
Mean Age of the study subjects according to thetumour grade.
|
Tumour Grade |
Age |
|
|
Mean |
SD |
|
|
Low Grade Tumours (N= 13) |
48.54 |
14.706 |
|
High Grade Tumours (N= 25) |
55.44 |
11.424 |
Table 3
Sex wise distribution of the study subjectsaccording to the tumour grade.
|
Tumour Grade |
Sex |
Frequency |
Percentage |
|
Low Grade Tumours (N= 13) |
Females |
4 |
30.80% |
|
Males |
9 |
69.20% |
|
|
High Grade Tumours (N= 25) |
Females |
11 |
44% |
|
Males |
14 |
56% |
Table 4
Table showing different DTI metrics according to tumour grades.
Table 5
Sensitivity, specificity, positive and negative predictive values (PPV and NPV), and accuracy of DTI Metrics.
Table 6
Table showing DTI metrics and its correlation with the grades of tumour
Table 7
Prediction of different range of DTI metrics.
Table 8
Optimum cut off values of differentmetrices of the tumoral and peri-tumoral regions with highest accuracy selected to differentiate the high grade from low grade gliomas
Table 9
Sensitivity, Specificity, NPV, PPV and Diagnostic Accuracy.
Graph 8
ROC curve 1: Graph showing receiver operating characteristics (ROC) curves of ADC (T) for differentiation of high grade from low grade tumours.
Graph 9
ROC curve 2: Graph showing receiver operating characteristics (ROC) curves of ADC (PT) for differentiation of high grade from low grade tumours.
Graph 10
ROC curve 3: Graph showing receiver operating characteristics (ROC) curves of AD (T) for differentiation of high grade from low grade tumours.
Graph 11
ROC curve 4: Graph showing receiver operating characteristics (ROC) curves of RD (T) for differentiation of high grade from low grade tumours.
Graph 12
ROC curve 5: Graph showing receiver operating characteristics (ROC) curves of CL (T) for differentiation of high grade from low grade tumours.
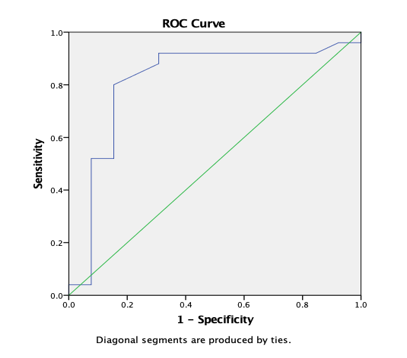
Graph 13
ROC curve 6: Graph showing receiver operating characteristics (ROC) curves of CL (PT) for differentiation of high grade from low grade tumours.
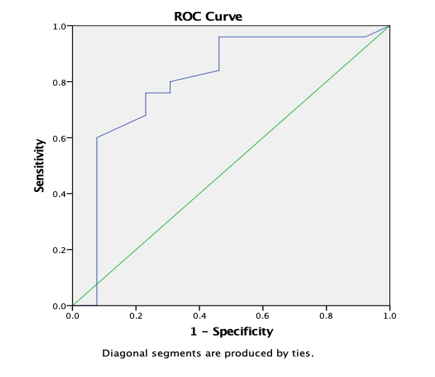
Graph 14
ROC curve 7: Graph showing receiver operating characteristics (ROC) curves of CP (T) for differentiation of high grade from low grade tumours.
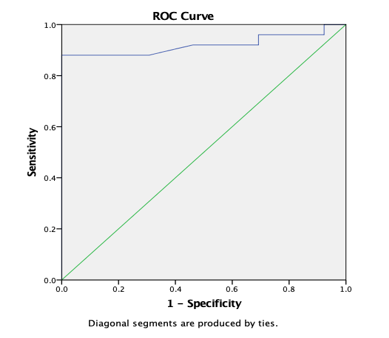
Graph 15
ROC curve 8: Graph showing receiver operating characteristics (ROC) curves of CP (PT) for differentiation of high grade from low grade tumours.
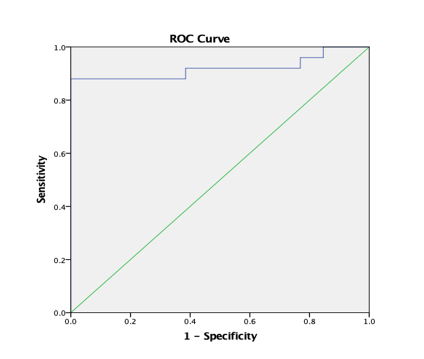
Figure 1
A-H (from left to right) - MRI of a 48 year old male with weakness of left upper limb and lower limb, imbalance while walking and diminution of left sided eye vision, revealed aheterogenous predominantly T2 (A) hyperintense T1 (B) isointense heterogeneously enhancing (C) mass lesion in right temporo-parietal lobe with areas of necrosis and haemorrhage (D) within. (E-H) DTI with ADC and FA maps demonstrating the lesion. Histopathology confirmed Glioblastoma multiforme.
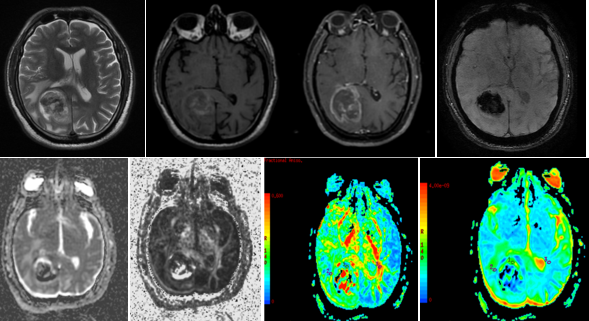
Figure 2
A-H (left to right) MRI of a 51 years old female with long standing on and off headache, vomiting and giddiness, imbalance while walking and complex partial seizures since 3 to 4 days showed a T1, T2 (A,B)heterogenous lesion in right high fronto- parietal lobe with significant perilesional edema. (C-F) DTI with ADC and FA maps demonstrating the lesion. (G,H) HPE revealed tumour composed of fibrillary astrocytes showing mildly enlarged oval nuclei. In regions rare oligodendroglial cells, cystic changes and foci of hemorrhages seen. No significant mitotic activity, necrosis or increase in the endothelial cells of vessels suggestive of DIFFUSE ASTROCYTOMA, GRADE II
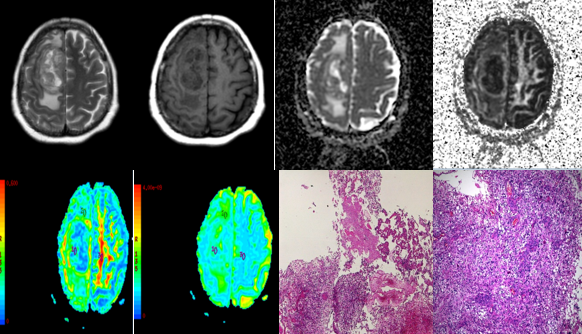
Figure 3
A-H (left to right) MRI of a 69 year old male with slurring of speech, deviation of angle of mouth to the left side since last 2-3 months showed (A) T2 heterogeneous lesion in the leftfronto-parietal area showing (B) heterogenous post contrast enhancement and (C,D) restricted diffusion. (E-H) DTI with ADC and FA maps (E,F,G,H) demonstrating the lesion. (I,J) HPE revealed tumour composed of gemistocytes, oligodendroglial cells and plenty of giant cells. Admixed are vessels showing endothelial cell proliferation. In regions few oval cells showing small round nuclei. No definite tumour necrosis is observed. Few giant cells show markedly bizarre nuclei. Findings suggested DIFFUSE ASTROCYTOMA GRADE – III.
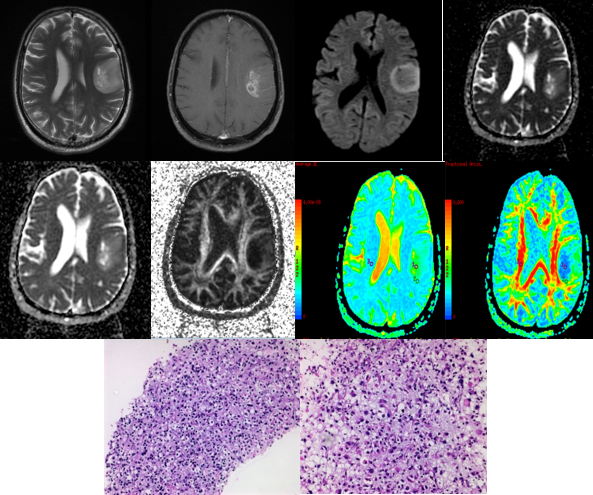
Figure 4
A-G (left to right) MRI of 45 year old male with headache and seizure revealed (A) T2 weighted images -heterogenous lesion with significant perilesional edema in left temporo- parietal area causing mass effect on midbrain. DTI with ADC and FA maps (B,C,D,E)) demonstrating the lesion. HPE (F,G) revealed tumorconsisting of sheets of oval cells showing markedly vacuolated cytoplasm. The centrally placed nuclei are rather pleomorphic in areas. Interspersed are islands of calcification and a few giant cells. In regions glomeruloid vessels and cells showing mitotic activity are observed. No necrosis is seen. Findings suggested ANAPLASTIC OLIGODENDROGLIOMA.
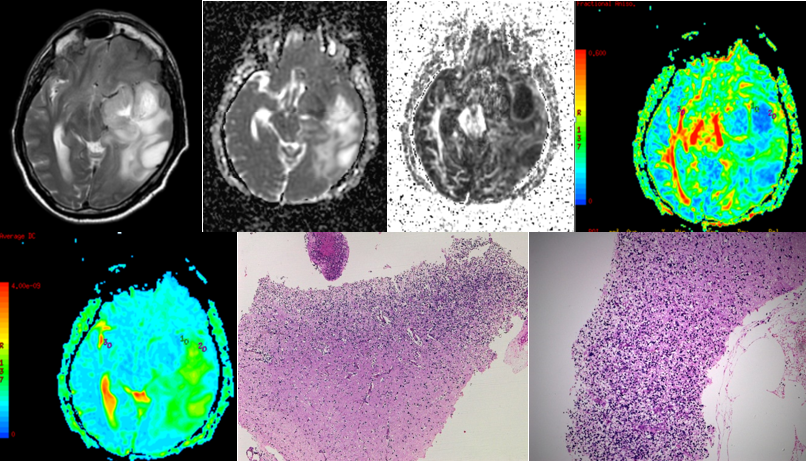
Figure 5
A-J (left to right) - MRI of a 77 year old female with headache and giddiness since one weekrevelaed heterogenously hyperintense lesion on t2 (A) and hypointense on T1 (B) in high parietal lobe. SWI (C) showed areas of hemorrhage within this lesion. Post contrast T1 W images (D) revelaed heterogeous peripheral enhancement. DTI with ADC and FA maps (E,F,G,H) demonstrating the lesion. (I,J) HPE revealed focally necrotic cellular tumour consisting of fibrillary astrocytes, focally appearing round which reveal pleomorphic, mitotically active nuclei. Admixed are plenty of vessels showing rather plump endothelial cells. No definite giant cells are seen. Findings suggested DIFFUSE ASTROCYTOMA GRADE 4
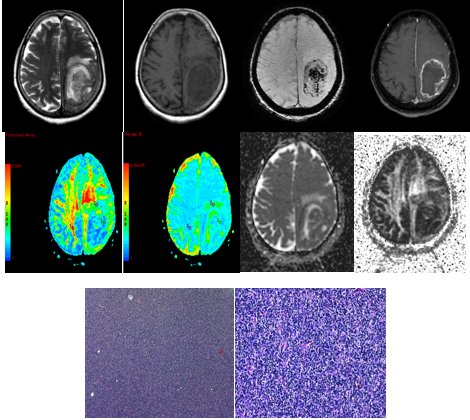
Figure 6
A-G (left to right) - MRI of 28 year oldmalewith headache since 10 years, generalised tonic clonic convulsions since one year , vomitting since one year and irrelevant talking since the last 2 days revealed large t2 (A) heterogeneously hyperintense lesion showing minimal patchy enhancement on post contrast T1 (C) occupying frontal horn and body of both lateral ventricles extending into right frontal lobe and right basal ganglia, causing perilesional edema and significant mass effect. DTI with ADC and FA maps (D,E,G,H) demonstrating the lesion. HPE revealed tumour composed of fibrillary astrocytes showing mildly enlarged oval nuclei. In regions rare oligodendroglial cells, cystic changes and foci of hemorrhages noted. No significant mitotic activity, necrosis or increase in the endothelial cells of vessels are seen. Findings suggested DIFFUSE ASTROCYTOMA, GRADE II
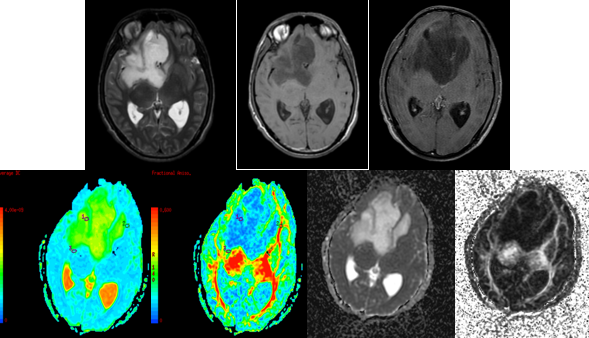
Figure 7
A-I (left to right) - MRI of a 53 year old female with weakness in the left upper lower limb since 1 month revealed a T2hyperintense (A), peripherally enhancing (B) centrally necrotic mass in right parafalcine perirolandic subcortical white matter, infiltrating into peritrigonal region, basal ganglia, thalamus, insular cortex, body and splenium of corpus callosum with extension to contralateral hemisphere showing SWI hypointensities within (C) and restricted diffusion (F,G) representing high grade primary brain neoplasm. DTI with ADC and FA maps (C,D,H,I) demonstrating the lesion.
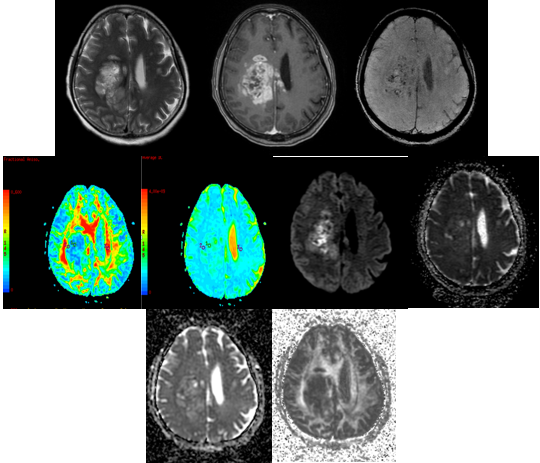
Figure 8
A-H (left to right) - MRI of a 60 year old male with headache and seizures revealed aheterogenous predominantly T2 hyperintense (A) T1 isointense (B) lesion in right temporal lobe showing restricted diffusion (C,D). DTI with ADC and FA maps (E,F,G,H) demonstrating the lesion.
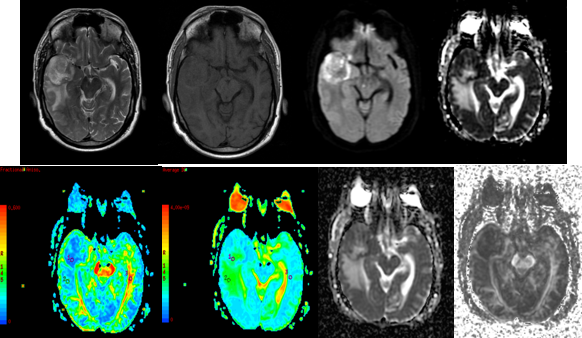
Figure 9
A-H (left to right) - MRI of 57 year old female revealed aheterogenous predominantly T2 hyperintense (A), T1 isointense (B) lesion in left parietal lobe crossing the midline and extending to the left parietal lobe. DTI with ADC and FA maps (C,D,E,F) demonstrating the lesion. HPE confirmed Glioblastoma Multiforme.
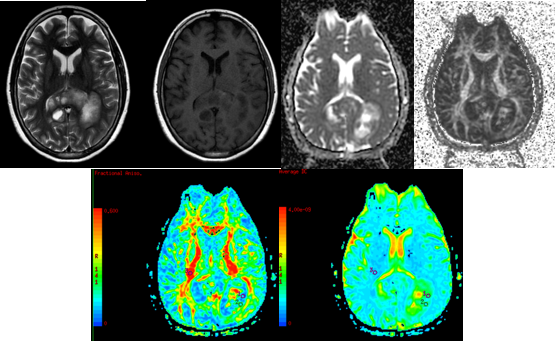
Figure 10
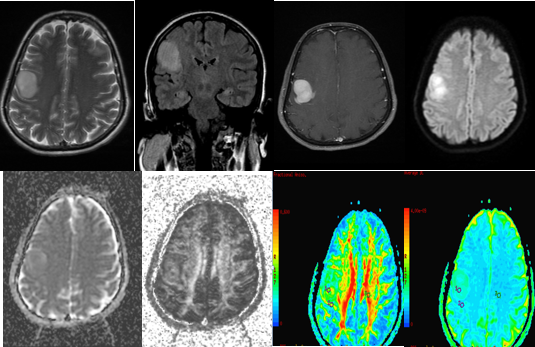
A-H (left to right) MRI of a 61 year old female withepilepsia partialis continua for 40 minutes and heaviness of left face and tongue for 1 weekshowed a T2 and FLAIR hyperintense (A,B) intensely homogeneously enhancing (B) lesion in right prerolandic gyri. DTI with ADC and FA maps (C,D,E,F) demonstrating the lesion. HPE showed GRADE 4 ASTROCYTOMA.
Conclusion
We have demonstrated the utility of DTI for the differentiation of High Grade from Low grade tumours. Our study confirms a good diagnostic performance for differentiating high-grade glioma from low grade tumours. Prediction of the cut off values of DTI metrics revealed high diagnostic accuracy and sensitivity for ADC(T), ADC(PT), AD (T), RD(T), CL(T), CL(PT) and CP(T) to differentiate High Grade from Low Grade Tumours.
Limitations
Since the sample of this study was relatively small, we need to be cautious when interpreting the results of this study. Also we were unable to recruit cases of Grade 1 glioma in our study.
Recommendations
We recommend further studies including a larger number of cases including fair number of all grades of glioma. With future research, DTI imaging modality may be further understood and optimized, for a better understanding in order to optimize patient outcomes.
Abbreviations
DTI: Diffusion Tensor Imaging, ADC: Apparent Diffusion Coefficient, MD: Mean Diffusivity, FA: Fractional Anisotropy, AD: Axial Diffusivity, RD: Radial Diffusivity, CL: Linear isotropy coefficient, CP: Planar isotropy coefficient, CS: Spherical isotropy coefficient, PPV: Positive Predictive Value, NPV: Negative Predictive Value, GBM: Glioblastoma Multiforme, WHO: World Health Organization, LGG: Low Grade Tumor, HGG: High Grade Tumor, WM: White Matter, NAWM: Normal Appearance White Matter, PT: Peri Tumoral, T: Tumor, AUC: Area Under The Curve, ROC: Receiver operating characteristics.


