- Visibility 197 Views
- Downloads 65 Downloads
- Permissions
- DOI 10.18231/j.ijn.2024.045
-
CrossMark

Improving breast-cancer diagnostics: A study using AI-ML with computational prognostics and feature extraction
Abstract
Background: Though and even though advancements are high during last two decades, yet ‘breast—cancer’ continues to be a sizable causal transience amongst females (womankind) globally. Whilst mammography has distinctly lowered death rates, detection and categorization and accuracy of breast sizes (forms in quantities) in mammograms remains argue. Thus we present a new method of detection and discovery of key region-of-interest(ROI) plus its labeling as natural usual ‘0’, benign ‘1’, or cancerous ‘2’ sizes.
Aim: For sorting of identified ‘ROIs’ as usual, benign or malicious exactly.
Materials and Methods: We use the removal of temporally sequential digital mammograms, merged via machine-learning (ML). We estimated feature-selection algorithmic techniques (ATs) over the novel database (data—set) comprises images~circa352 as of 88 diseased exactly noted by sites-of-mass. 98 feature extractions were done and classified by 8 dissimilar feature-selection ATs to detect the best discriminative features. We then computed 10classifiers via first in first out (FIFO) diseased plus a k-fold cross validation. In our computation, we observed the artificial neural nets (ANNs) appeared as the highest classifier with 99.5%accuracy, 0.98AUC (for label ‘0’), 0.92AUC (for label ‘1’, plus 0.94AUC (for class ‘2’).
Results: Our findings showed significant progress in divergence (disparity) through existing advanced high-tech algorithms and techniques, which feature worth of using temporally successive mammographs in amalgamation, with advanced computational intelligence ML, aimed at the exact sorting of identified ‘ROIs’ as usual, benign or malicious.
Conclusion: Clinical significancy/ when clinically applied, this study improves the clinical prognosis precision of breast-cancer possibly steering to reliable diseased outcomes plus added personalized therapeutic attempts.
Introduction
The breast-cancer (BC) is an important research area, and global health is very much concerned. On the map of science, the world health organization (WHO) is predicting 24.7 million cases also circa ~13million cancer-related deaths and through the major health hazards globally by the end of the year 2030.[1] The BC accounts for nearly ~15% of those cases, with incidence-rates that have steadily ascended or augmented/(risen), through 0.5%annually, from the time 2005. [2] The mammography, in conjunction with sensible assessment, is presently the ut-most at best efficient testing/screening sense of modality for the BC. [3]
Even though latest technological innovations, the BC findings remain a challenge because of the distinctive and exceptional-unique nature of BC lesions, plus low-imaging-contrast/pixel-resolutions and spatio-temporals because of the dynamic range quantization-errors. [2], [3], [4], [5] At the moment, the assessment of mammographs needs a consent amongst dual authoritative neuro-radiologists, augmented through the third person if at all required. [6] The radiological sorting of BC anomalies as benign, non-threatening or skeptical depends on the factors/parameters for instance, phase-angle which represents the shape, consistency, and spatial-temporal-information. [3], [7] Suspect mass-tumors of breast are generally heavier in addition differentiated through the random and uneven and spiculated limitations, however nonthreatening (i.e.,benign) mass-tumors characteristically expose spherical (sphere-shaped), distinct yet well-defined boundaries and margins with no penetrated or subverted limits. [4], [5], [6], [7], [8], [9] Nonetheless, expanded breast-density becomes identification further intriguing by restricting the scene of irregular and unusual abrasions/laceration’s, and lesions, etc. [10] Womankind through the solid (dense-breasts) impenetrable yet compact are at a greater-menace and/or risk, as the compassion(sensitivity) of mammograph is condensed by round about30% for these cases. [5], [11]
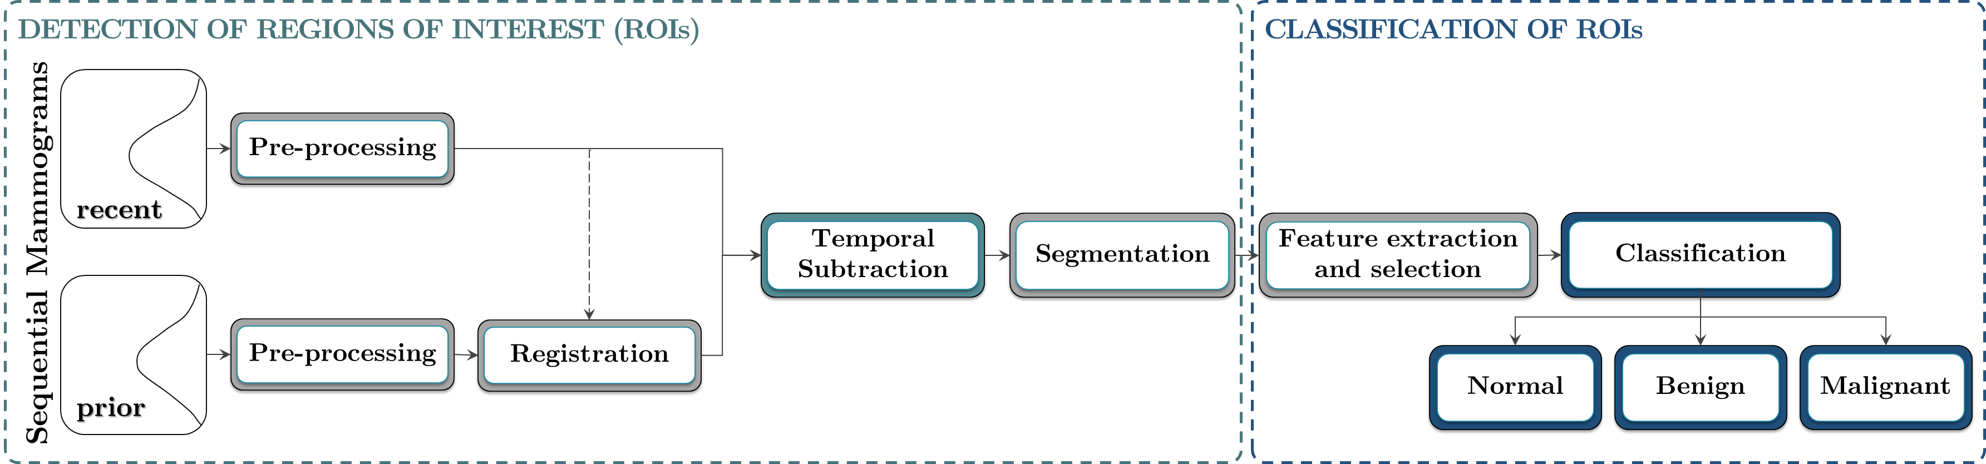
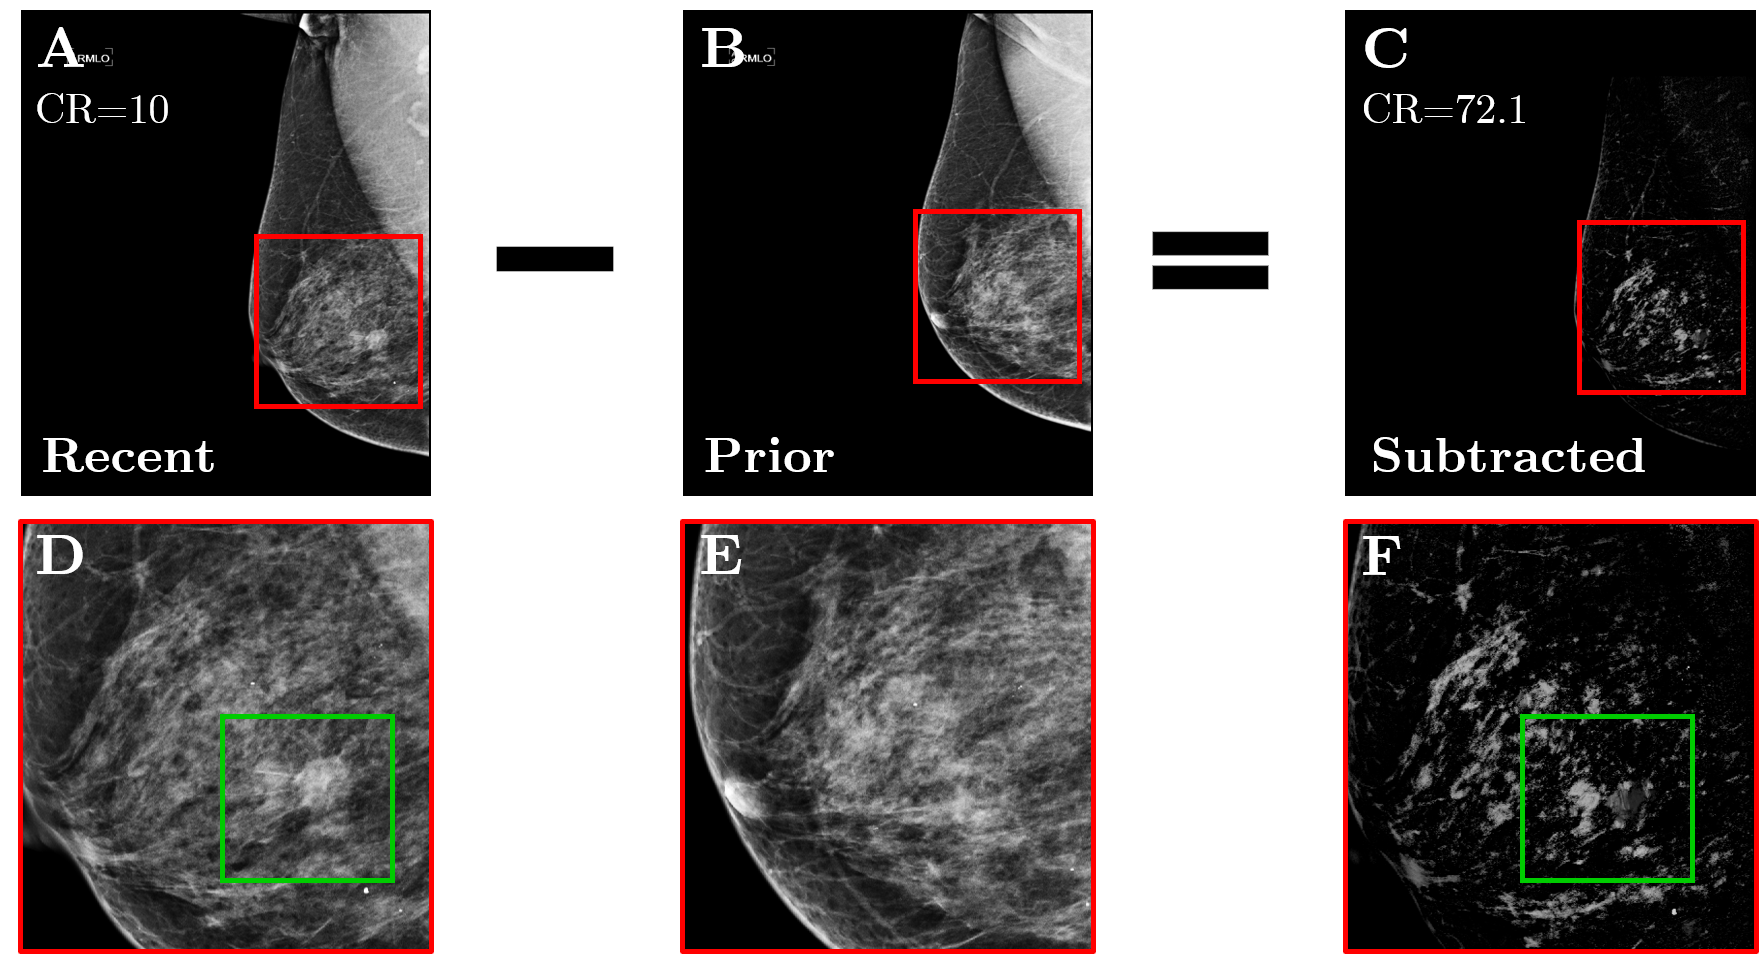
Over the past three decades, Computer-Aided Diagnosis (CAD) systems have been introduced to assist radiologists in detecting and classifying breast cancer. [6], [12] Nonetheless, most of the algorithmic-techniques suggested within the literature-survey expect exclusively and uniquely over the latest mammograh for the diagnosis. [13] Alas, and inappropriately, through this strategy, chronological images of the identical subject (disease patient) are not compared, to detect latest differences. [14] For the radiologists, such assessments play a pivotal-role in distinguishing freshly refurbished irregularities or swiftly switching areas and regions (breast-tumors zone) amongst transmissions, in cooperation both grave and serious features, aspects and characteristics in safeguarding precise analysis and judgment in clinical and quantifiable repetition. Consumption of preceding mammograms projection C A D machines/systems has been constrained. [7], [15] Nevertheless, lately, we established better-quality sorting/, i.e., classification execution by applying the elimination of temporally progressive cardinal, digital mammograms in sequence with feature-based AI machine learning supervised classification algorithmic-techniques for both micro-classifications(MCs). [8] as well as masses. [9], [16], [17], [18], [19], [20], [21] This study, present a unique innovative algorithmic-technique for the discovery and detection plus automatic grouping of BC-lesions as well as tumors ([Figure 1]), furthermore utilizing the abstraction of temporally consecutive digital mammograms. This strategic-approach is separated into two-fold most important segments: (A) detection of the region-of-interest (RoI) plus (B) computerized 3 - class categorization of the discovered ROIs as standard (i.e., normal), nonthreateining (benign), or cancerous.
The estimation was executed over the a novel data set particularly acquired for this research-study, and gathering the data as-of 88 subjects (i.e., diseased patients). Overall, 98features were extrapolated as of identified RoI`s, monitored through their ranking by applying eight-8 unique feature-selection algorithmic-techniques. Ten-10 classifiers were estimated, in conjunction with justification methods, to realistically distinguish the RoIs as whichever normal-standard(0), benign-masses(1), or malignant-masses(2). By employing this thorough and widespread strategic-approach, the best successful order-of-features as well feature-classifiers (also feature-associations) were elicited. The suggested procedure is sketched schematically as showed in Illustration—schematic diagram ([Figure 2]).
Methods and Design Techniques
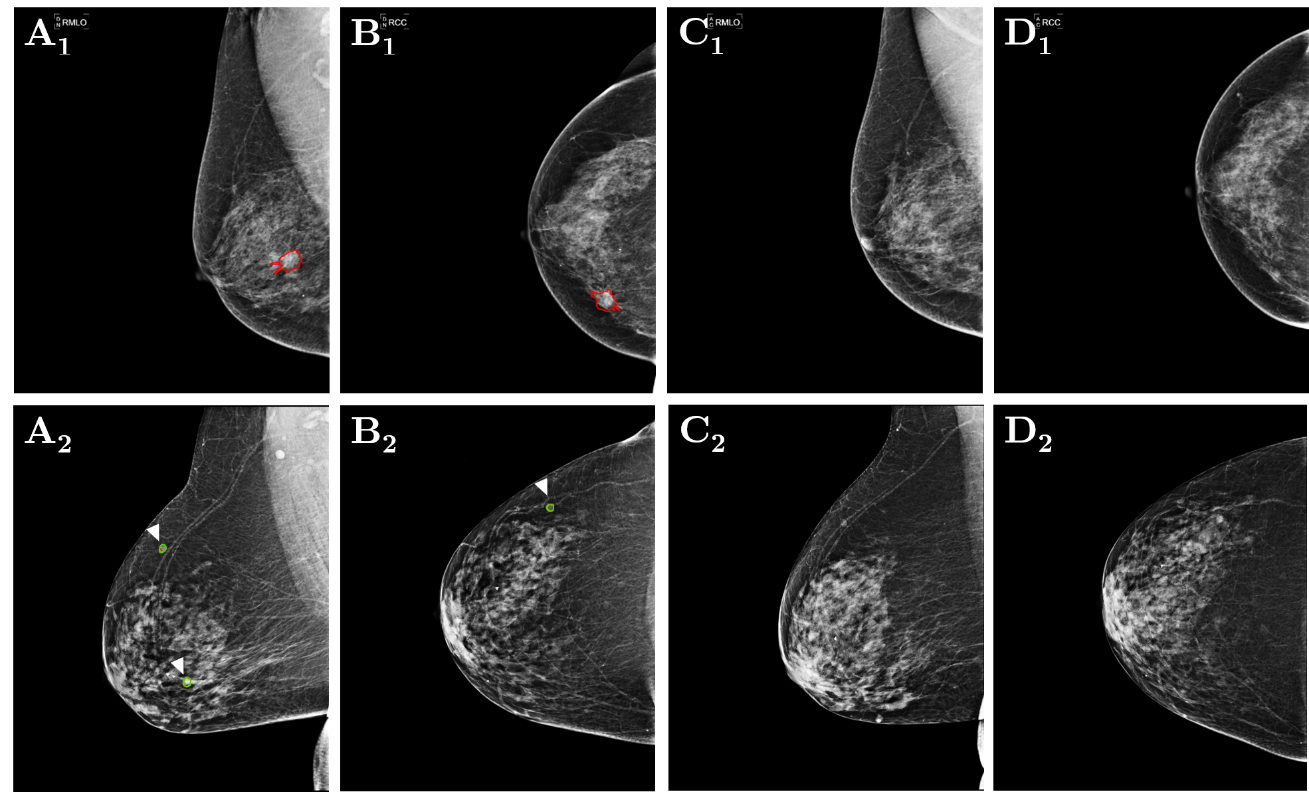
A novel data set was mandatory for this research-study because of publicly available data sets (libre) do not restrain successive mammograms also, in certain cases, comprise archaic or invalid (or outdated) or checked-images. Moreover, this custom-built data set incorporates accurate annotations of discrete masses, performing as the milled certainty ([Figure 3]). The data set was traced as of numerous investigation centers throughout- C M R Institute of Medical Sciences Hospital, and research center employing aged female typically 40-81 years. Every participant provided two mammographic—views: the cranio-caudal (CC) plus the medio-lateral-oblique (MLO) as of two chronological transmission rounds give rise to in a data base containing of 352images. The mean interval concerning sequential examinations was approximately∼2 years.
The board, i.e., panel consisted dual skilled-radiologists designated/ or nominated and estimated all imagery, observing the masses as whichever benign or suspicious. Afterwards, unreliable cases experienced verification via biopsy, after that histo-pathological inferences, checking their cancerous nature. Out of the 88 patients, 38 presented with at least one biopsy-confirmed malignant mass in their most recent screening, plus 15 exhibited uniquely ‘benign-masses’ in the maximum current mammograms(BI-RADS2). The lasting 35 cases had typical fresh/latest mammographic views through neither benign nor unreliable outcomes (BI-RADS 1). In ∀ cases, the preceding mammograms were standard. The study was approved by the C M R ethics committee.
The detection and supervised ML-segmentation
To concoct and formulate the mammograms for the inferences (to be deduced), an initial series of pre-processing steps were executed ([Figure 4]).
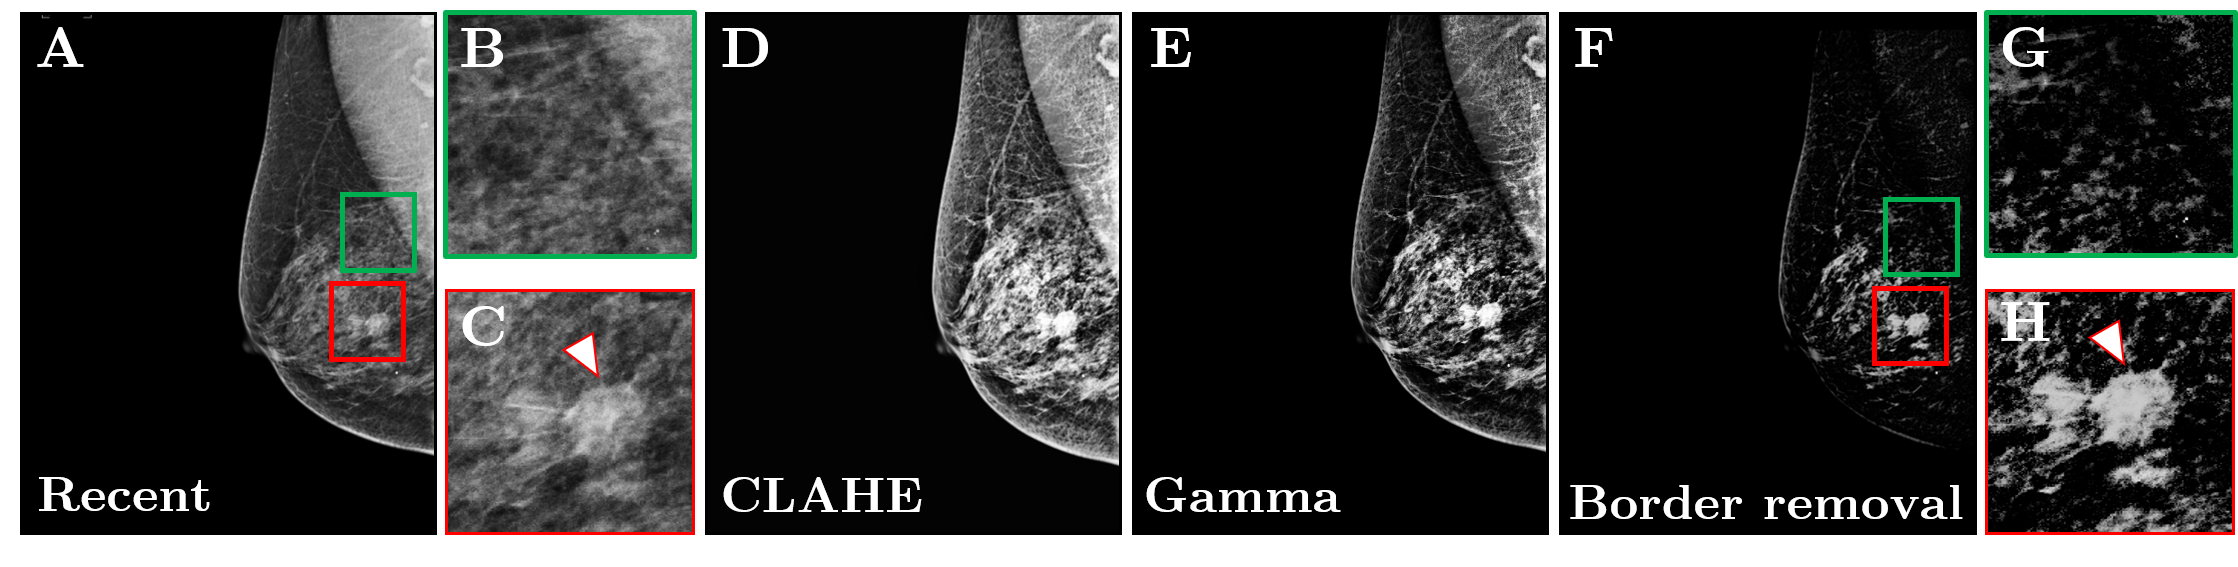
Firstly, the data was normalized (i.e., normalization) i.e., for standardizing the pixels-intensity-values throughout the imagery ( ∀ images). Consequently, 3sequential-filtering techniques were employed: (1) Contrast Limited Adaptive Histogram Equalization (CLAHE), (2) gamma -γ-correction, and (3) edge-removal. The CLAHE was implemented using [8] tessellations(tiles) to successfully restructure the images’ grey-levels.[10] Gamma -γ-correction reallocated the image intensities to the newer scale, plus γ was set to 2.[11] Edge-removal reduced high-intensity regions linked to the edge, principally freeing the pectoralis(pectoral-muscle).[12] Exact registration concerning the fresh and preceding mammographic imagery(images) was vital to prevent mis configuration(alignment) of subsequent places throughout the elimination-stage. Such artifacts might cooperate with the grouping precision. Registration-process is compulsory to offset/(compensate) for compound-factors pretending chest, i.e., breast-imaging, plus differences within the breast-compression, changes in shape-of-breast, inconsistencies in the authority of the pectoralis (pectoral-muscle) analysis, in the M LO as well as prospective human-errors ensuing at the time-of-screening.[13] Demons’ registering, which essentially handles non-linear phase (with different phase frequencies, and angles) i.e., shape distortions(deformations), was chosen for this problem. The moving-image (preceding) was aligned to the fixed-one (i.e., latest one) utilizing the similarity of the area (local, or regional) plus place. Dualistic (binary), i.e., Dual-stage registration was employed (the whole shape registration followed by the detailed registration). Then, the preceding registered imagery was detracted as of latest, i.e., modern one, also a novel take-off image was built. [14] ([Figure 4]).
The take-off (detracted) imagery was (far-off) administered by applying the unsharp-mask-filtering, a spatial-filter which improves the range-of-higher frequencies. [15] The segmentation-process required 3steps: (1) The thresholding, (2) Application of morphological-operations, and lastly (3) rejection of border (edge) tessellation’s/pixels. Primarily, the administered imagery undertook thresholding, transforming it into the binary, to eliminate low-intensity regions absolutely distinct and irrelevant to malformed (irregular) zones. The threshold -value was selected utilizing histogram-analysis plus optimization of the comprehensive grouping (taxonomy) rate. The then, morphological (i.e., different kinds) operations were applied to the binary-image. The erosion was used to remove remote-pixels that are isolated causing from mis alignment or thresholding-artifacts. Terminating was directed to merge the adjoining-pixels. The erosion-process used the radius-of 2pixels, < average mass-radius. The closure was accomplished through the radius-of 10pixels to detect the mass-constituents. The dimensions was chosen understanding numerous property-testing. The last and final-step, i.e., computational implied removing the high-intensity pixel-regions which, presumably, related to the skin-of breast, a region which cannot establish the masses(mass-tumors). Which was attained through the discovering breast-periphery plus eliminating all the high-intensity zones positioned over this periphery, successively. The algorithmic-technique deemed the continuing zones as valuable region of interests.
Feature— extraction
Feature-extraction/selection
The AI machine learning (ML) was applied to differentiate the RoI`s as normal, benign-masses, or malignant-masses. Different feature-manifestations have been recommended for the identification of breast-cancer BC anomalies in the earlier research-studies.[6] In total we have extracted ninghty-eight98 features from every RoI, plus they are alienated into five 5 major classes, namely, epidemiological, phase (shape-based), current intensity-based, first-order statistics(FoS), and grey level co-occurrence matrix(GLCM), etc., feature-manifestations. And they were were explicitly chosen by judging their efficacy in AI-ML nonetheless, they are also, attributes/entities characteristically computed and estimated by the expert-radiologists to measure suspect RoIs. Every G L C M feature-manifestation was derived a0°, 45°, 90°, plus135°degrees, by the mean as well as standard deviation (SD) attained, ensuing in 24values for every counterbalance, i.e., offset ’D’. To determine the highest appropriate yet correct-offset, we tested three values, D1=5, D2=15, and D3=25), giving the total 72GLCM feature-manifestations. Unnecessary and unwanted features ought to be and must be removed and this mainly for optimizing the outcome of the classification. Consequently, many methods and techniques (i.e. feature-selection), were equated to detect the greatest active feature amalgamation: (1) the student ‘t’—test, (2) Maximum relevance-minimum redundancy(MRMR), (3) Feature-significancy by employing the extra trees(FI-ET, or FS-ET), (4) Feature Importance/significancy using Random Forest (FI-RF, or FS-RF), (5) Feature-importance/significancy using XG-Boost (FI-XGB, FS-XGZ), (6) Select-K-Best, (7) Sequential Forward Selection (SFS), and (8) Sequential Backward Selection (SBS). The hypothesis/rationale t-test was performed 3times (3×) to evaluate every set-of- classes: 0 verses. 1, i.e., 0 v/s 1, 1 v/s. 2, and 0 v/s. 2. Following this process, the features were ranked based on their p-values respectively. To discover the highest and significant features from all the associations/relationships (upon comparison), a popular rule approach was used. For the first six-6-techniques, a score was computed/generated for every- feature, yet 20features only through higher scores considered. In the S F S as well S B S, the algorithmic-techniques were optimized to discover the best-performance amongst 1 to 20 features. The scientific-rationale, i.e., hypothesis backside utilizing several feature -manifestations and selection techniques lies within the fact that every technique relies on dissimilar theories or principles, ensuing in a distinct ranking order. Merging these rankings via the majority-rule, where feature-manifestations general to >3 techniques are taken, stemmed in a amalgamated feature-set (TABLE I). Consequently, to estimate the efficiency of the chosen feature-manifestations, multidimensionality for the multidimensional scaling, i.e., Multivariate Analysis of Variance (MANOVA) was applied. Such statistical variate facilitates and evaluate how the chosen features mutually influence and impact to the overall predictive performance. This optimization procedure was done throughout neural-nets-training. In real-world conditions, data set disparities/unevenness are widespread, and allocating with uneven among normal-regions, benign and and malignant masses. To balance for such an imbalance, synthetic minority oversampling technique(SMOTE) was employed to compute/generate innovative examples-of the marginal-class within the neural-nets training-set.[16] and it alleviates (moderates) and also mitigates the class-imbalance problem by over sampling the (double the Nyquist-criterion) under signified-class.2)
The neural-nets training plus analogy of classifier designs
For classifying the detected RoIs, 3-class categorization was done to distinguish them as: normal class- 0’, benign mass class- 1’, or malignant mass class- 2’. The 9leading classifiers were measured which include linear discriminants analysis (a statistical variation analysis technique), k-nearest neighbors(k-NN), support-vector machine (SVM), Random-forest(RF), Extra-trees(ET), Multi-layer perceptron(MLP), Ada-boost (ADA), Gradient boosting(GB), and Ensemble-voting. for k-NN, a range-of nearest-neighbor-values(1,3,5,7,9, and 11, in a similar manner of Fibonacci series) were assessed to define the optimal-setting. For the S V M, numerous kernel-functions for instance, linear, polynomial, and radial-basis functions (RBFs) were estimated, to determine the highest appropriate method. In the ensemble voting method, both hard and soft programs were measured. Furthermore, numerous artificial neural-nets (ANN) architectures were verified, improving the parameters of the net-work based on confirmation loss as well as precision.
The classifiers were trained and tested by using dualistic validation techniques: Leave-one-patient-out (LOPO) and k-fold-patient cross-validation (CV, and k=4,11). The justification per subject (patient) is vital to avoid every bias as of existence of imagery from the identical subject both in NN-training as well as testing-sets. In two, LOPO plus the k-Fold CV, the data as ∀ subject incorporated whichever in the NN-training or testing the test-set yet not together.
To estimate the sorting’s efficiency, basic metrics involving sensitivity, specificity, plus accuracy, i.e., precision, plus the area under the curve(‘AUC’) were computed for every class, i.e., for ‘0’, ‘1’, and ‘2’, in conjunction with the complete total measurement for precision. For the measurement of these metrics per class, every class was labelled as positive (+Ve), through other two measured as negative(-Ve). All the computations were done in Mat Lab statistical and neural tools and were fully used for feature extraction and certain feature selection algorithms (t-test and MRMR). Python (version 3.7.7; Python Software Foundation, Delaware, U.S.A.) was utilized for feature—selection (feature importance, Select-K-Best, S F S, and S B S), plus taxonomy issues.
Results
For estimating the usefulness of temporal—subtractions, the contrast-ratio (i.e., ‘CR’) of the deducted imagery was matched through the consistent ‘CR’ of the very latest imagery following the pre-processing. Through induction of registration plus temporal removal, the ‘CR’ intensified almost~2×times: 45.1 v/s. 84.4. This improvement ensued in a visually enhanced imagery encompassing freshly established zones (areas, regions) only, or regions which altered considerably among the investigations. The procedure-process needed an standard of 15minutes (0.9kS) per imagery set and the typical configuration/technical specifications was: 12th Generation Intel-chip set(R) and Core (TM) i7 with 1.7 Giga Hz.
Throughout feature—selection, a sequence of all strategies and techniques were applied to detect the features together with the majority of the yest substantial input to grouping, utilizing the mainstream popular-rule. The chosen feature-manifestations are showed in bold-faced within the [Table 1].
|
t-test |
MRMR |
FI-ET |
FI-RF |
FI-XG |
SelectKBest |
SFS |
SBS |
|
MAL1 |
STD |
STD |
Variance |
Corr. 90 D1 |
MAL |
MAL |
Area |
|
Corr.2 Mean D3 |
Corr. Mean D1 |
Variance |
Solidity |
STD |
Mean intensity |
Eccentricity |
Perimeter |
|
Corr. 135 D3 |
Corr. Mean D3 |
Smoothness |
STD |
Solidity |
STD |
ED |
Corr. Mean D2 |
|
Corr. 45 D3 |
Corr. STD D1 |
Solidity |
Smoothness |
Major axis length |
Variance |
Solidity |
Corr. STD D2 |
|
Corr. Mean D2 |
Corr. 0 D2 |
Extent |
Extent |
Corr. Mean D3 |
Corr. 45 D1 |
STD |
Compactness |
|
Corr. 90 D3 |
Kurtosis |
Mean intensity |
Corr. Mean D2 |
Filled area |
Corr. 135 D1 |
Entropy |
|
|
|
|||||||
|
Corr. 45 D2 |
Corr. 90 D3 |
Corr. Mean D2 |
Corr. Mean D3 |
Corr. STD D3 |
Corr. Mean D1 |
Contrast 0 D1 |
|
|
Contrast STD D3 |
Energy 45 D3 |
Corr. Mean D3 |
Mean intensity |
Corr. Mean D2 |
Contrast 45 D2 |
Corr. 45 D1 |
|
|
Contrast STD D2 |
Max intensity |
Corr. Mean D1 |
Circularity |
Extent |
Contrast 135 D2 |
Contrast 45 D2 |
|
|
Contrast 45 D2 |
Corr. 45 D2 |
Energy 45 D1 |
Shape ratio |
Area |
Contrast Mean D2 |
Contrast 135 D2 |
|
|
Corr. 135 D2 |
Corr. 135 D2 |
MAL |
Corr. 135 D1 |
Contrast 90 D3 |
Contrast STD D2 |
Corr. Mean D2 |
|
|
Corr. 90 D2 |
Corr. 45 D1 |
Corr. 0 D2 |
Perimeter |
Perimeter |
Corr. 0 D2 |
Corr. 90 D3 |
|
|
Corr. 0 D3 |
Corr. 90 D2 |
Corr. 0 D1 |
Area |
Contrast STD D2 |
Corr. 45 D2 |
Corr. Mean D3 |
|
|
Contrast 0 D2 |
Corr. 0 D3 |
ED3 |
Corr. 90 D3 |
MAL |
Corr. 90 D2 |
Age |
|
|
Compactness |
Corr. 135 D1 |
Energy 135 D1 |
Corr. 0 D1 |
Contrast STD D1 |
Corr. 135 D2 |
|
|
|
Shape ratio |
Entropy |
Max intensity |
MAL |
Corr. 45 D1 |
Corr. Mean D2 |
|
|
|
Corr. STD D1 |
Corr. 135 D3 |
Corr. 90 D2 |
ED |
Corr. 0 D2 |
Contrast 0 D3 |
|
|
|
Corr. 45 D1 |
Corr. Mean D2 |
Corr. 0 D3 |
Corr. 45 D2 |
Homogeneity STD D2 |
Contrast 45 D3 |
|
|
|
Circularity |
Energy 0 D1 |
Compactness |
Convex Area |
Circularity |
Contrast 90 D3 |
|
|
|
Mean intensity |
Solidity |
Corr. 135 D2 |
Corr. Mean D1 |
Contrast 0 D3 |
Contrast 135 D3 |
|
|
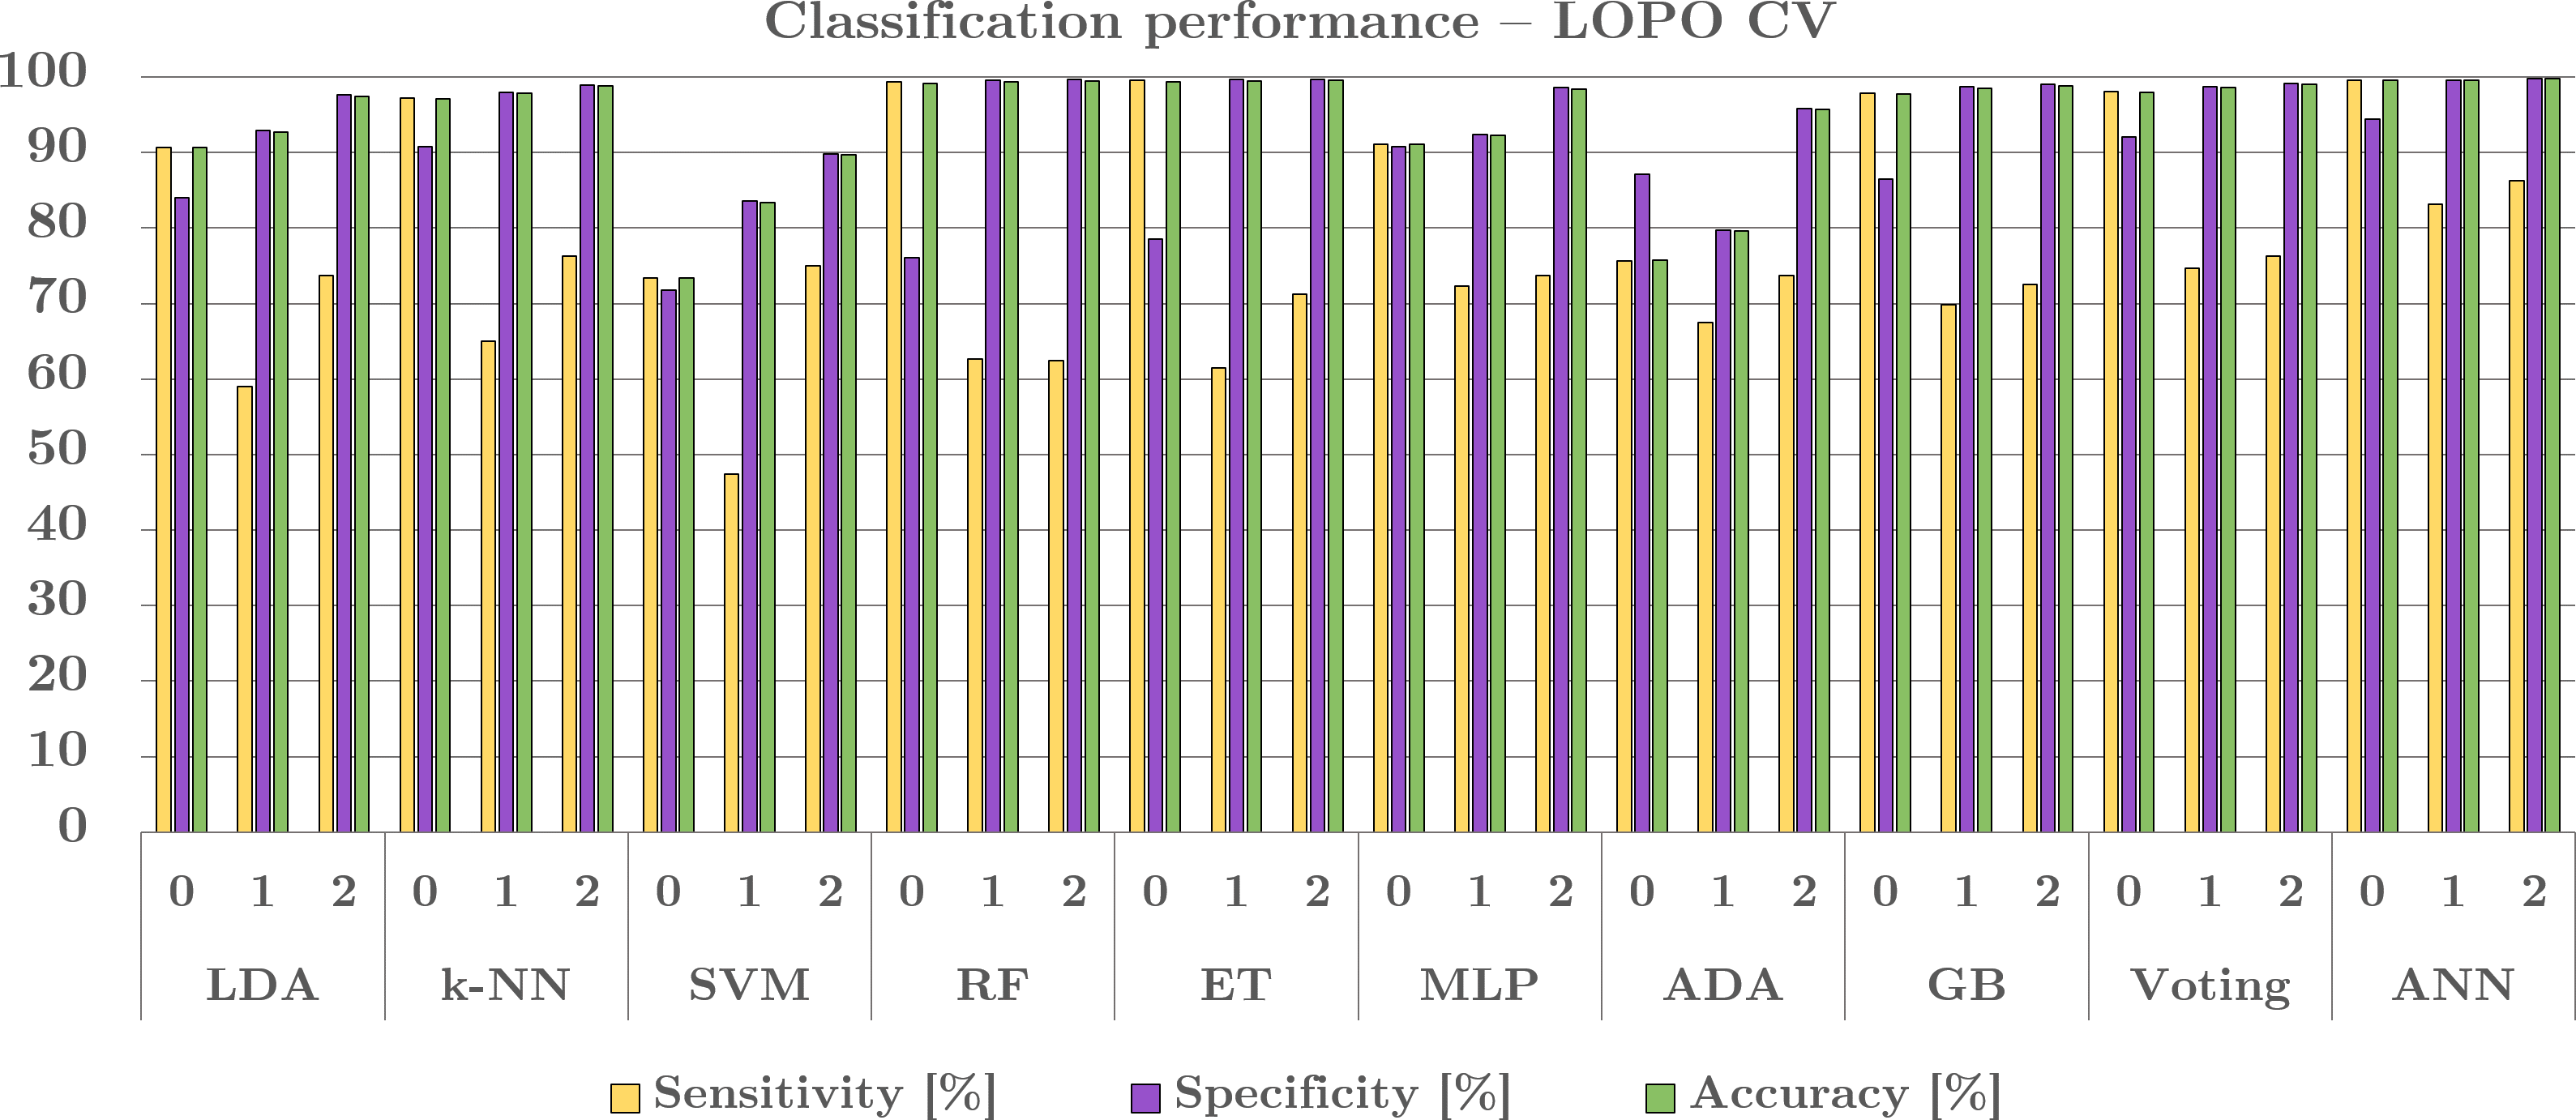
Then all the features chosen were incorporated into many groups, and improved for a 3-class category, utilizing the L O P O C V, see in Figure5. The greatest and best steady execution was accomplished with the artificial neural-nets, that achieved 99.4% accuracy and overall precision, 0.98AUC for the class ‘0’, and for 0.91 AUC for class –‘1’, and 0.93 AUC for class-‘2’. The model employed the artificial neural-nets architecture encompassing 3hidden-layers (‘92,184,368’) amongst 93,015trainable factors (i.e., parameters). The activation functions encompassed a rectified linear unit (Re-LU) in the i/p plus hidden-layers, whilst the o/p layer commissioned a soft-max -function. Following every hidden-layer, consignment normalization was employed, coupled through the advanced adaptive drop out regularization (varying from ‘0.2’ to ‘0.3’), which was incorporated in the unique and third-hidden-layers. Furthermore, Gaussian-noise (‘0.1’) was incorporated as a regularization technique to reinforce the AN net-work’s strength. In addition, also, the Adam-optimizer was devoted, through the size-set to~128, plus the learning-rate of0.0001 (10-4), plus the net - work was artificially trained with NNs for 100epochs. In connection with the other classifiers, the L D A was executed by applying the linear discriminant principle plus exclusive of earlier possibilities. For the k - ANN, the k-mean was set-to 3 by the closest tie-breaking algorithmic-technique. For SVM, we have used the radial—basis function ‘kernel’. Plus, the ensemble (i.e., aggregate) voting was built by combining quadratic discriminant analysis (Q D A), M L P, as well as the gradient boosting ‘GB’, in a soft voting-scheme.
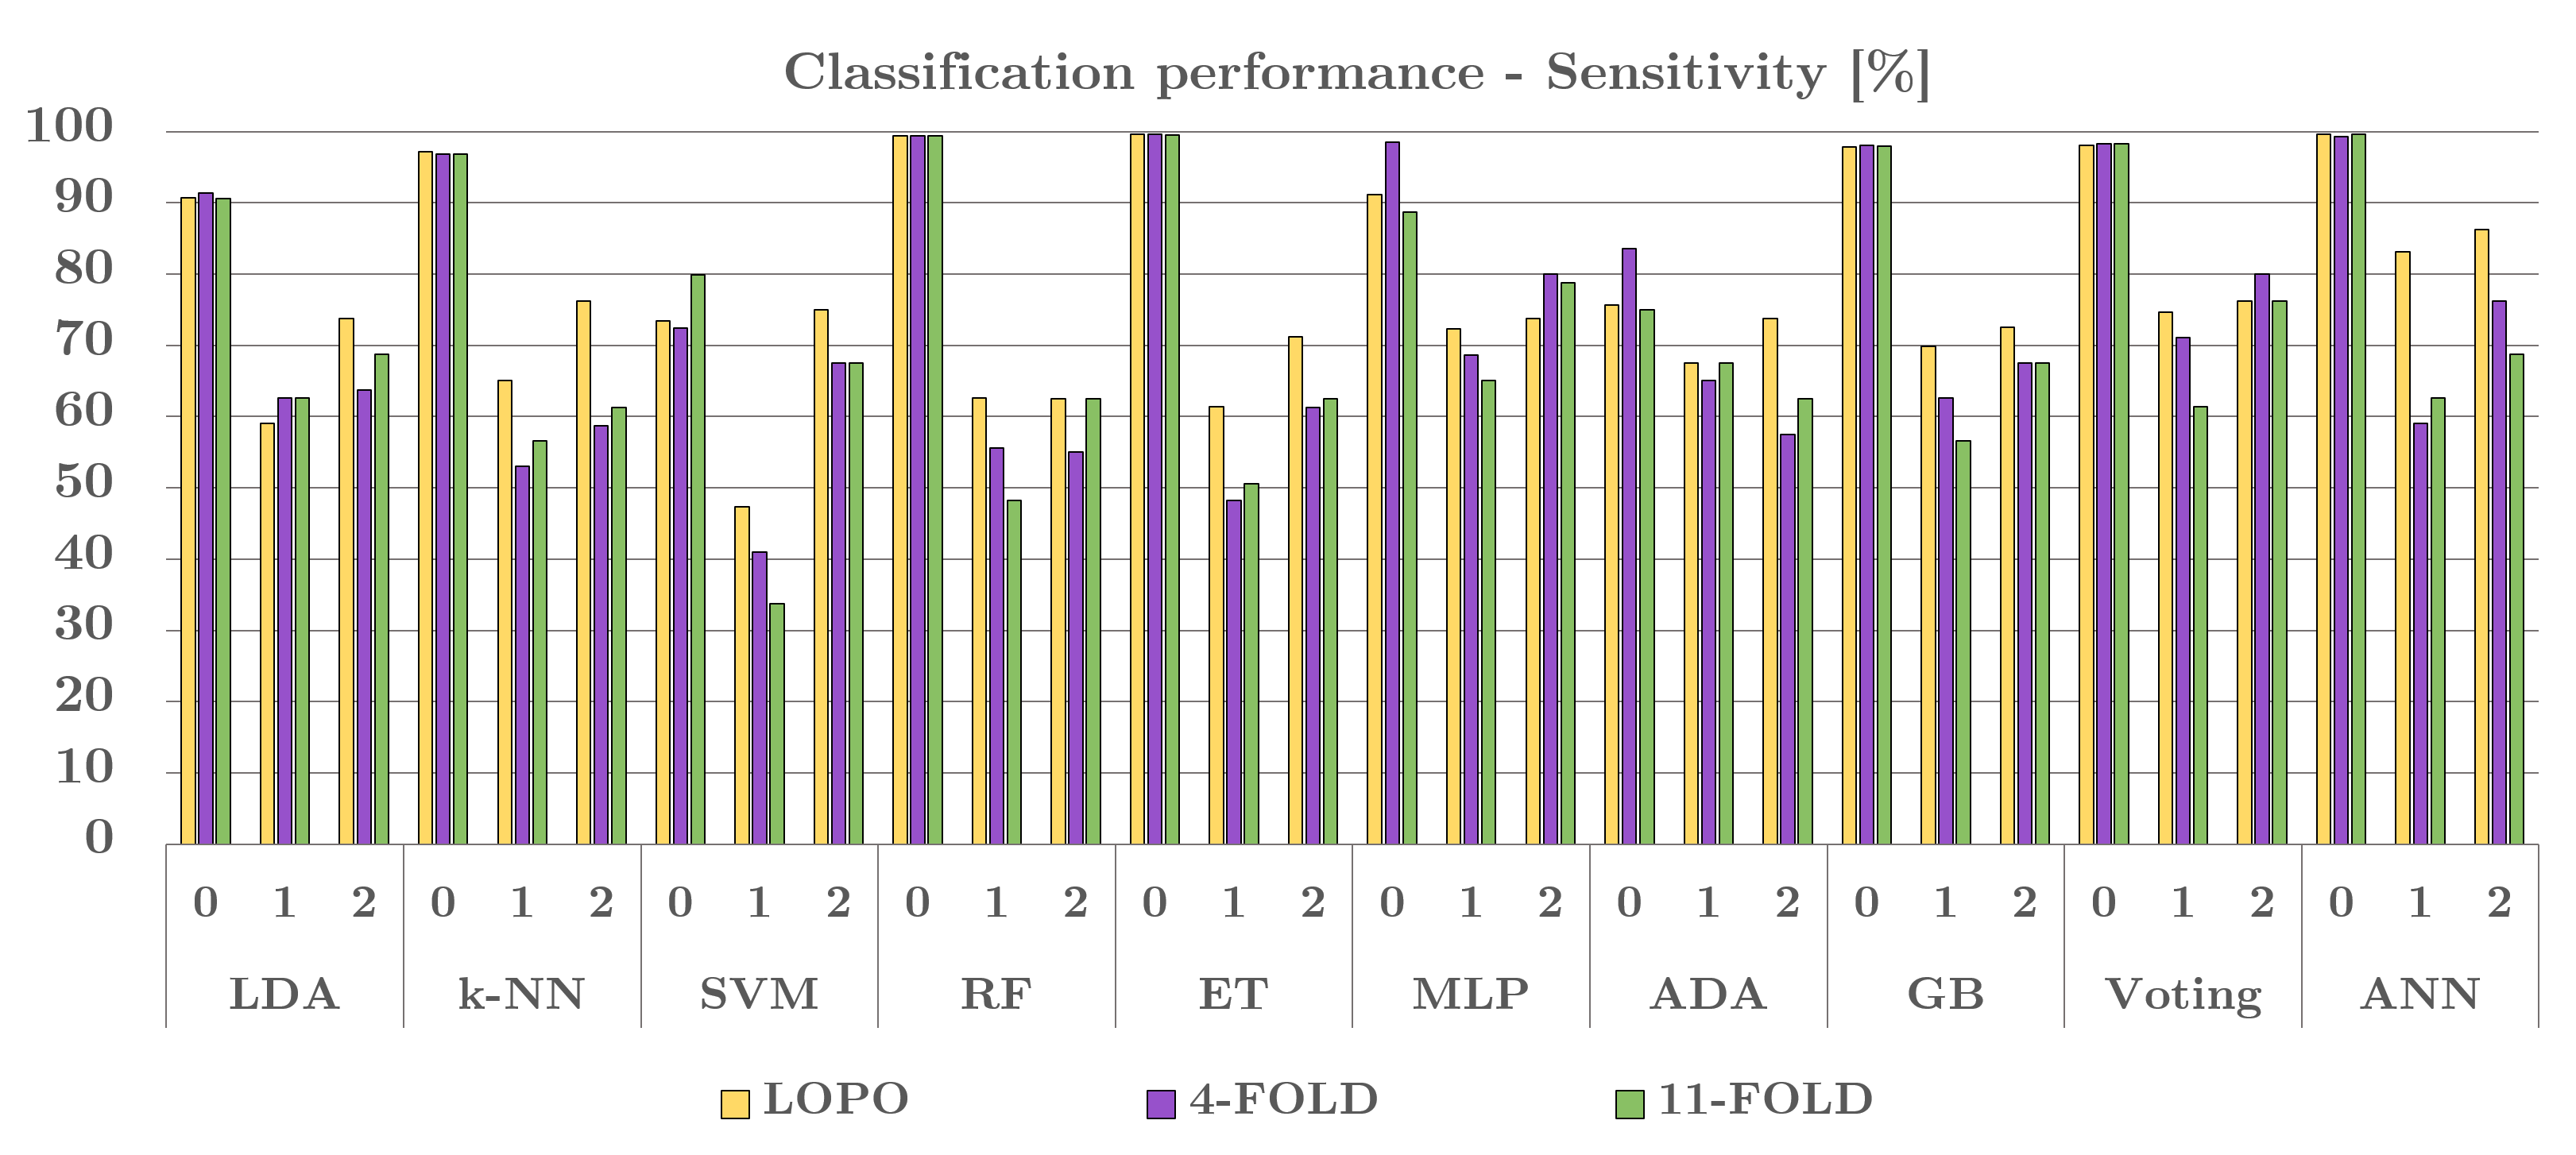
The grouping performing was estimated with the k-Fold cross-validation (CV), utilizing 4, plus 11 - folds. The algorithmic-technique unveiled reliable execution for dual settings, a sign of its robustness, and the entire class/grouping (i.e., classification) outcome (sensitivity), are illustrated in [Figure 7].
Discussion
We evaluated a novel algorithmic-technique in this study for mainly detection automatically (through the computation) plus a `3-class’ grouping, i.e.,classification of breast-cancer (BC) masses (tumors), by applying the removal of temporally serial or sequential digital mammo-grams (massive mammographic signals data) as well as feature—based AI-ML. The artificial neural nets we got excellent sensitivity for all three classes, i.e., for the class-0’~99.6% sensitivity, for the class-‘1’ ~83.1% sensitivity and for the class-‘2`~86.2% sensitivity, by applying the LOPO CV, by an typical-average of 0.47 false-Ves per every imagery. The prominence on sensitivity is to focus the value of minimalizing the cases in which the subjects (patients) are erroneously acquitted regardless of covering the disorder.
Together with LOPO CV, the ‘4-fold’ plus ‘11-fold’ CV were commissioned (employed) to evaluate the algorithmic-techniques and corresponding modules strength, robustness. An insignificant performing reduction was monitored within the sensitivity, given the decreased neural-net-training data, v/s the 87diseased-subjects in ‘LOPO CV’. This decrease emphasizes the necessary for a substantial data set whilst asserting the algorithmic-techniques capability to classify the latest (newfound) data perfectly.
Using the computation (for subtracting purposes) of temporally—progressive mammograph’s aimed at the BC malignancy diagnostic-findings is a novel therapeutic technological approach strategically, which makes the contrast directly with other research-studies very challenging, thought-provoking. The disparities within the data sets, pre-processing methods and techniques, CV-techniques, the classifiers, as well as the standard estimation methods/techniques, more impede divergence directly. Certain algorithmic-techniques planned for the sorting of breast-cancer masses as/tumors benign or malignant by means of progressive mammo-grams plus temporal examination, yet deprived of inevitably (i.e., through the automatic computation) grouping the discovered RoIs utilizing the ‘3-class’ group, or utilizing temporal removal. [17], [18], [19]
Our method presents enhanced and superior implementation related to the research information in which successive (in chronological) mammograms are applied (see TABLE II for computational values). Nevertheless, it’s significant to memorandum that the planned temporal removal algorithmic-technique, contrasting conventional temporal analysis-techniques, emphases on inevitably (i.e.,automatically) discovering as well as grouping newly amplified malformations or markedly transformed areas among the subsequent (in sequence) sequential-investigations. Therefore, the main input of this strategic-approach is its ability and power to capture-obtain plus rank progressing incongruities, eventually.
The research in this project implies a moderately, yet reasonably (and relatively) tiny data set using out of all proportion data as an outcome of the real-world encounters in amassing as well annotating two successive disks of mammograms for every candidate (participated). This procedure decrees/mandates continual development also imposes precise specifications, for instance, having a standard mammogram in the preceding investigating if a mass-tumor exists in the latest one. Furthermore, the cases linked through the breast-masses/turmors need tissue removal (biopsy) and checking for the validation and verification for cancer confirmation. Using widely accessible databases like the libre software (open free source and data is public free) was unreasonable because such data do not incorporate dual rounds of digital mammograms per every subject (patient), or comprehensive annotations and tissue removal endorsements and validations. Another constraint of this study is the likelihood of differences in the annotations if multiple experts were evaluating the same mammograms which was not explored yet.
Conclusion
We estimated a new algorithmic-technique for the discovery and classification computationally (automatic without any human intervention) of breast-cancer (BC) lesions-or tumors by leveraging temporally sequential digital mammograms, and feature-based AI-ML. We split the process into twofold sections: (A) finding of RoIs, and (B) 3-class classification of RoIs as normal, benign, or malignant masses automatically.
|
|
# of p/t`s |
Classifier |
Data validation techniques |
AUC |
|
Hadjiiski, et.al., [17] |
140 |
LDA |
Leave-one-out (per patient) |
0.88 |
|
Timp,et.al., [18] |
465 |
SVM |
20-fold CV (per ???) |
0.77 |
|
Bozek,et.al., [19] |
60 |
LDA |
Leave-one-out (per ???) |
0.90 |
|
Planned |
88 |
ANN |
Leave-one-out (per patient) |
0.97 |
|
|
|
|
|
0.91 |
|
|
|
|
|
0.93 |
This evaluation utilized a newly collected dataset consisting of data from 88 patients, with 352 images over two time-points (recent and prior mammograms with two breast views). Employing several feature extraction and selection methods, the statistically significant features crucial to the classification were identified. We accomplished the best execution with the ANN, attaining 99.4% overall accuracy, 0.97 AUC for class 0, 0.91 AUC for class 1, and 0.93 AUC for class 2. These results outperformed existing techniques that employed sequential mammograms and temporal analysis, showcasing the algorithm’s improved diagnostic capabilities. The encouraging outcome of present research justifies more probe involving a larger patient cohort. Through continued expansion and refinement, the proposed algorithm holds promise to substantially enhance the development of automated CAD systems, potentially leading to significant improvements in patient prognosis and clinical outcomes.
Source of Funding
None.
Conflict of Interest
None.
References
- Ferlay J. Global cancer observatory: Cancer tomorrow. . 2022. [Google Scholar]
- Xie W. Breast mass classification in digital mammography based on extreme learning machine. Neurocomputing. 2016;173(3):930-41. [Google Scholar]
- Oliver A, Freixenet J, Martí J, Pérez E, Pont J, Denton E. A review of automatic mass detection and segmentation in mammographic images. Med Image Anal. 2010;14(2):87-110. [Google Scholar]
- Rangayyan R. A review of computer-aided diagnosis of breast cancer: Toward the detection of subtle signs. J Franklin Inst. 2007;344(3-4):312-48. [Google Scholar]
- . Dense breasts - fact sheets - yale medicine. . . [Google Scholar]
- Loizidou K. Computer-aided breast cancer detection and classification in mammography: A comprehensive review. Computers Biol Med. 2023;153. [Google Scholar] [Crossref]
- Loizidou K. A Review of Computer-Aided Breast Cancer Diagnosis Using Sequential Mammograms. Tomography. 2022;8(6):2874-92. [Google Scholar]
- Loizidou K, GS, Pitris C, Nikolaou C. Digital subtraction of temporally sequential mammograms for improved detection and classification of microcalcifications. Eur Radiol Exp. 2021;5(1). [Google Scholar] [Crossref]
- Loizidou K, GS, Nikolaou C, Pitris C. Automatic breast mass segmentation and classification using subtraction of temporally sequential digital mammograms. IEEE J Transl Eng Health Med. 2022;10. [Google Scholar] [Crossref]
- Agrawal S, Rangnekar R, Gala D, Paul S, Kalbande D. Detection of breast cancer from mammograms using a hybrid approach of deep learning and linear classification. . 2018. [Google Scholar]
- Huang S. Efficient contrast enhancement using adaptive gamma correction with weighting distribution. IEEE Trans Image Processing. 2013;22(3):1032-41. [Google Scholar]
- Gonzalez R, Woods R, Eddins S. . Digital image processing using MATLAB. 2010. [Google Scholar]
- Marias K, Behrenbruch, C, Parbhoo S, Seifalian A, Brady M. A registration framework for the comparison of mammogram sequences. IEEE Trans Med Imaging. 2005;24(6):782-90. [Google Scholar]
- Pennec X, Cachier P, Ayache N, CT, AC. Understanding the “demon’s algorithm”: 3d non-rigid registration by gradient descent. . 1999. [Google Scholar]
- Chan H. Digital mammography. roc studies of the effects of pixel size and unsharp-mask filtering on the detection of subtle microcalcifications. Invest Radiol. 1987;22(7):581-9. [Google Scholar]
- Chawla N, Bowyer K, Hall L, Kegelmeyer W. Smote: synthetic minority over-sampling technique. J Artif Intell Res. 2002;16:321-57. [Google Scholar] [Crossref]
- Hadjiiski L, Sahiner B, Chan H, Petrick N, Helvie M, Gurcan M. Analysis of temporal changes of mammographic features: computer-aided classification of malignant and benign breast masses. Med Phys. 2001;28(11):2309-17. [Google Scholar]
- Timp S. Temporal change analysis for characterization of mass lesions in mammography. IEEE Trans Med imaging. 2007;26(7):945-53. [Google Scholar]
- Bozek J, Kallenberg M, Grgic M, Karssemeijer N. Use of volumetric features for temporal comparison of mass lesions in full field digital mammograms. Med Physics. 2014;41(2). [Google Scholar] [Crossref]
- Gurcan MN, Boucheron LE, Can A, Madabhushi A, Rajpoot NM, Yener B. Histopathological image analysis: A review. IEEE Rev Biomed Eng. 2009;2:147-71. [Google Scholar] [Crossref]
- Janowczyk A, Madabhushi A. Deep learning for digital pathology image analysis: A comprehensive tutorial with selected use cases. J Pathol Inform. 2016;7. [Google Scholar] [Crossref]